HOT TOPICS LIST
- MACD
- Fibonacci
- RSI
- Gann
- ADXR
- Stochastics
- Volume
- Triangles
- Futures
- Cycles
- Volatility
- ZIGZAG
- MESA
- Retracement
- Aroon
INDICATORS LIST
LIST OF TOPICS
PRINT THIS ARTICLE
by Alan R. Northam
With the NASDAQ now in a bear market trend, it is possible to use Elliott wave theory to forecast when the downward trend will come to an end.
Position: N/A
Alan R. Northam
Alan Northam lives in the Dallas, Texas area and as an electronic engineer gave him an analytical mind from which he has developed a thorough knowledge of stock market technical analysis. His abilities to analyze the future direction of the stock market has allowed him to successfully trade of his own portfolio over the last 30 years. Mr. Northam is now retired and trading the stock market full time. You can reach him at inquiry@tradersclassroom.com or by visiting his website at http://www.tradersclassroom.com. You can also follow him on Twitter @TradersClassrm.
PRINT THIS ARTICLE
ELLIOTT WAVE
Looking For The NASDAQ Bottom
10/08/08 09:14:13 AMby Alan R. Northam
With the NASDAQ now in a bear market trend, it is possible to use Elliott wave theory to forecast when the downward trend will come to an end.
Position: N/A
| Elliott wave theory states that after a five-wave advance the market will undergo a three-wave market correction. Further, we can state that a major market top always ends with the completion of a wave 5 advance. With respect to NASDAQ, it is a fact that the bull market ended in 2000 with the bursting of the technology bubble marking the top of a secular bull market trend. Therefore, we can conclude that this market top completed a five-wave advance. Following this major market top, the NASDAQ has been undergoing a three-wave market correction. Three-wave market corrections are composed of one wave down, one wave up, and a final wave down. Ralph Nelson Elliott labels these three waves as A, B, and C, and calls them zigzags. Elliott also observed that waves A and C of a zigzag are typically of equal length. Elliott also stated in his research that once a market correction is over, a new five-wave advance would begin. Therefore, to determine the bottom of the current bear market for NASDAQ, it is necessary to identify the three corrective waves, and once these three waves are complete, then a new bull market trend will begin. |
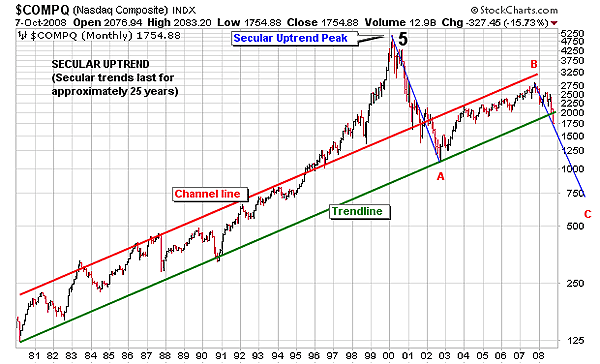
| Figure 1 shows the monthly bar chart of NASDAQ. This chart shows that NASDAQ has been in a major bull market upward trend since before 1980. Such long upward trends are known as secular trends and last approximately 25 years. Figure 1 also shows that this secular trend of NASDAQ peaked in 2000 and has been undergoing a market correction over the last eight years. Figure 1 also shows that wave A of the ABC zigzag correction ended in 2002 and wave B in 2007. Wave C of this ABC market correction has now been under way since late 2007. Note that NASDAQ has now broken down below its upward-sloping trendline, confirming that wave C down is now in progress. |

|
| FIGURE: NASDAQ, MONTHLY. This figure shows the secular bull market trend and the market top in early 2000. This figure also shows that the market has been in a market correction over the last eight years and is not expected to end until early 2010 at a price level of 618. |
| Graphic provided by: StockCharts.com. |
| |
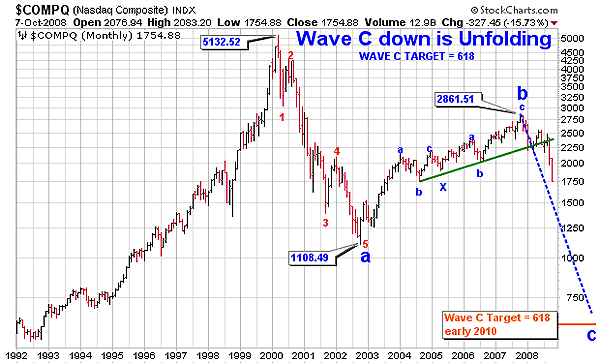
| Figure 2 is also a monthly bar chart of NASDAQ but shows only the last 16 years. This chart shows the price of NASDAQ at the secular market top, the end of wave a, and the end of wave b. I have also drawn a downward-sloping dotted blue line at the same slope as wave a and the same length. Wave a started in early 2000 and ended in late 2002 and took approximately two and a half years to complete. Given that wave c started in late 2007 and should take approximately two and a half years to complete, wave c should be complete sometime in early 2010. To calculate the expected price of NASDAQ, once wave c down is complete, we take the ratio of 5132.52, divide by 1108.49, and divide this ratio into 2861.51 to arrive at the quotient of 618. |

|
| FIGURE 2: NASDAQ, MONTHLY. This figure also shows the monthly bar chart of NASDAQ showing the Elliott wave count. This figure shows that the market is undergoing an ABC zigzag market correction, with wave C now unfolding. Note the time and price target for the completion of wave C and the end of the bear market trend. |
| Graphic provided by: StockCharts.com. |
| |
| We can use the Elliott wave theory tenets to forecast the end of the bear market for NASDAQ. Having identified the length and time of wave a and the end of wave b, it is possible to forecast the time and price for the completion of wave c the end of the bear market for NASDAQ. This analysis shows that we can expect the bear market for NASDAQ to be complete in early 2010 at a price level of 618. Once wave c becomes more fully developed, it will be possible to again use the Elliott wave theory to more accurately determine the end of the bear market for NASDAQ. |
Alan Northam lives in the Dallas, Texas area and as an electronic engineer gave him an analytical mind from which he has developed a thorough knowledge of stock market technical analysis. His abilities to analyze the future direction of the stock market has allowed him to successfully trade of his own portfolio over the last 30 years. Mr. Northam is now retired and trading the stock market full time. You can reach him at inquiry@tradersclassroom.com or by visiting his website at http://www.tradersclassroom.com. You can also follow him on Twitter @TradersClassrm.
| Garland, Tx | |
| Website: | www.tradersclassroom.com |
| E-mail address: | inquiry@tradersclassroom.com |
Click here for more information about our publications!
Comments
Date: 10/12/08Rank: 5Comment:

Request Information From Our Sponsors
- StockCharts.com, Inc.
- Candle Patterns
- Candlestick Charting Explained
- Intermarket Technical Analysis
- John Murphy on Chart Analysis
- John Murphy's Chart Pattern Recognition
- John Murphy's Market Message
- MurphyExplainsMarketAnalysis-Intermarket Analysis
- MurphyExplainsMarketAnalysis-Visual Analysis
- StockCharts.com
- Technical Analysis of the Financial Markets
- The Visual Investor
- VectorVest, Inc.
- Executive Premier Workshop
- One-Day Options Course
- OptionsPro
- Retirement Income Workshop
- Sure-Fire Trading Systems (VectorVest, Inc.)
- Trading as a Business Workshop
- VectorVest 7 EOD
- VectorVest 7 RealTime/IntraDay
- VectorVest AutoTester
- VectorVest Educational Services
- VectorVest OnLine
- VectorVest Options Analyzer
- VectorVest ProGraphics v6.0
- VectorVest ProTrader 7
- VectorVest RealTime Derby Tool
- VectorVest Simulator
- VectorVest Variator
- VectorVest Watchdog
