

HOT TOPICS LIST
- MACD
- Fibonacci
- RSI
- Gann
- ADXR
- Stochastics
- Volume
- Triangles
- Futures
- Cycles
- Volatility
- ZIGZAG
- MESA
- Retracement
- Aroon
INDICATORS LIST
LIST OF TOPICS
PRINT THIS ARTICLE
by David Penn
High volume on the left shoulder of this topping formation adds to a bearish picture for this downwardly sloping H&S top.
Position: N/A
David Penn
Technical Writer for Technical Analysis of STOCKS & COMMODITIES magazine, Working-Money.com, and Traders.com Advantage.
PRINT THIS ARTICLE
HEAD & SHOULDERS
Lennar's Head and Shoulders Top
06/21/01 07:51:11 AMby David Penn
High volume on the left shoulder of this topping formation adds to a bearish picture for this downwardly sloping H&S top.
Position: N/A
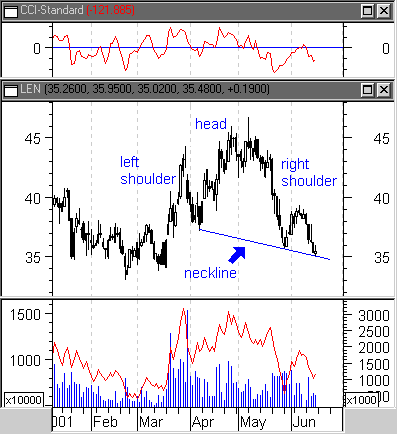
| Lennar Corporation (LEN) is perhaps one of many homebuilding companies that is enjoying the stirring sensation of the Federal Reserve's relentless interest rate cutting campaign. With continued weakness in the stock market and in the economy, Fed watchers already are anticipating another 50 basis point cut in rates when the Fed meets at the end of June. Those in interest-rate sensitive industries, such as finance and home construction, are understandably keeping their lamps lit for first signs of another Fed easing. |
| How any interest rate rally will or will not affect Lennar Corporation's stock price is anyone's guess. However, how any rate cut would find Lennar Corporation over the next few weeks may be another matter entirely. Because for all the company's success in 2001 (and LEN has climbed from a mid-March low of about 34 to a mid-May new high of 46, a 35% advance), Lennar Corporation's stock has been showing dangerous signs of topping over the past few months. And with prices drifting down toward 35 in June, LEN looks likely to retest year-to-date lows only a month after setting a new 52-week high. |
|
| Figure 1: Beyond the February/March congestion, there is little to slow a downside breakout from this H&S top. |
| Graphic provided by: MetaStock. |
| |
| A closer look at the topping movement in LEN helps show how this might come about. The stock declined going into 2001, falling from 40 to 34 from January to mid-March. At mid-month, however, a large buying day kicked off a two-week advance as LEN climbed from 34 to 44. A correction followed. Tellingly, the largest volume day for LEN in a year occurred during this correction, as prices ended the month at about 37.5, retracing almost half of the March advance. While it may seem easier to say now, the heavy volume selling day (note the sharp decline in on-balance volume) during the LEN correction should have been seen as a warning when shares of LEM began again to climb. Volume during the April/May advance was not spectacular--particularly when compared to the heavy volume, selling day in late March--even as LEN advanced to set a new 52-week high in May. |
| Again, LEN corrected, breaking down from a consolidation between 43 and 45 to reach 35.5 by the end of May. Smaller volumes accompanied a short rally stretching out of the end of May to the beginning of June. But this buying was not nearly enough to counter the strong downtrend that appeared to develop as of mid-May. This price action--a high volume advance (left shoulder) followed by a higher advance on somewhat less volume (the head) followed by a third advance that is approximately as large as the first advance (right shoulder)--is the defining characteristic of the H&S top formation. |
| I won't spend too much time on the genealogy of H&S tops--having already pointed to a number of similar formations recently on Traders.com. Suffice to say that they appear primarily as a result of greed (three peaks) succumbing reluctantly to fear (the two troughs and the possibility of a downside breakout). In order to measure the size of a downside breakout, the formation height is subtracted from the value at the neckline (the neckline being that area where the lows of the two troughs can be connected with a straight line). In the case of LEN, a downside price objective of 25 or 26 can be looked for, a price LEN last reached in August 2000. |
Technical Writer for Technical Analysis of STOCKS & COMMODITIES magazine, Working-Money.com, and Traders.com Advantage.
| Title: | Technical Writer |
| Company: | Technical Analysis, Inc. |
| Address: | 4757 California Avenue SW |
| Seattle, WA 98116 | |
| Phone # for sales: | 206 938 0570 |
| Fax: | 206 938 1307 |
| Website: | www.Traders.com |
| E-mail address: | DPenn@traders.com |
Traders' Resource Links | |
| Charting the Stock Market: The Wyckoff Method -- Books | |
| Working-Money.com -- Online Trading Services | |
| Traders.com Advantage -- Online Trading Services | |
| Technical Analysis of Stocks & Commodities -- Publications and Newsletters | |
| Working Money, at Working-Money.com -- Publications and Newsletters | |
| Traders.com Advantage -- Publications and Newsletters | |
| Professional Traders Starter Kit -- Software | |
Click here for more information about our publications!
Comments
Date:�06/27/01Rank:�4Comment:�

Request Information From Our Sponsors
- StockCharts.com, Inc.
- Candle Patterns
- Candlestick Charting Explained
- Intermarket Technical Analysis
- John Murphy on Chart Analysis
- John Murphy's Chart Pattern Recognition
- John Murphy's Market Message
- MurphyExplainsMarketAnalysis-Intermarket Analysis
- MurphyExplainsMarketAnalysis-Visual Analysis
- StockCharts.com
- Technical Analysis of the Financial Markets
- The Visual Investor
- VectorVest, Inc.
- Executive Premier Workshop
- One-Day Options Course
- OptionsPro
- Retirement Income Workshop
- Sure-Fire Trading Systems (VectorVest, Inc.)
- Trading as a Business Workshop
- VectorVest 7 EOD
- VectorVest 7 RealTime/IntraDay
- VectorVest AutoTester
- VectorVest Educational Services
- VectorVest OnLine
- VectorVest Options Analyzer
- VectorVest ProGraphics v6.0
- VectorVest ProTrader 7
- VectorVest RealTime Derby Tool
- VectorVest Simulator
- VectorVest Variator
- VectorVest Watchdog