HOT TOPICS LIST
- MACD
- Fibonacci
- RSI
- Gann
- ADXR
- Stochastics
- Volume
- Triangles
- Futures
- Cycles
- Volatility
- ZIGZAG
- MESA
- Retracement
- Aroon
INDICATORS LIST
LIST OF TOPICS
PRINT THIS ARTICLE
by James Kupfer
The S&P 500 has moved into prime short-term buying territory with today's move.
Position: Buy
James Kupfer
Mr. Kupfer is a market professional and amateur stock market commentator. Disclosure: It is likely that Mr. Kupfer has or will enter a position in any security he writes about.
PRINT THIS ARTICLE
FIBONACCI
Time To Buy SPY
10/07/08 08:53:50 AMby James Kupfer
The S&P 500 has moved into prime short-term buying territory with today's move.
Position: Buy
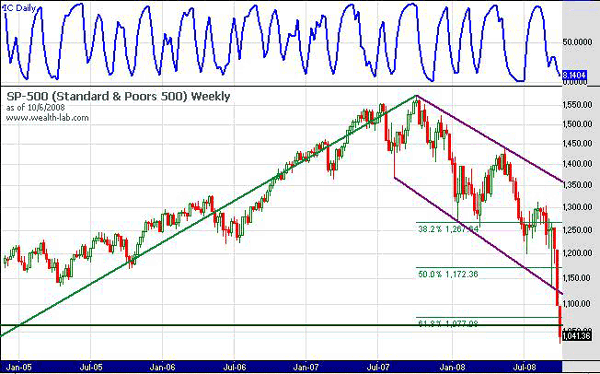
| Last Monday (September 29), I wrote regarding the Standard & Poor's 500: "In my estimation, the next logical [support] zone is where the 61.8% Fibonacci level and the August 2004 bounce coincide at roughly 1070." Albeit much quicker than I anticipated, this forecast has come to fruition. With today's move, the S&P 500 is currently trading at 1013 on an intraday basis. I have included an updated S&P chart in Figure 1 (prior to the end of the trading day). |

|
| FIGURE 1: S&P 500, WEEKLY. The market is approaching a point where traders can close out short positions and look to establish short-term long positions. |
| Graphic provided by: Wealth-lab. |
| |
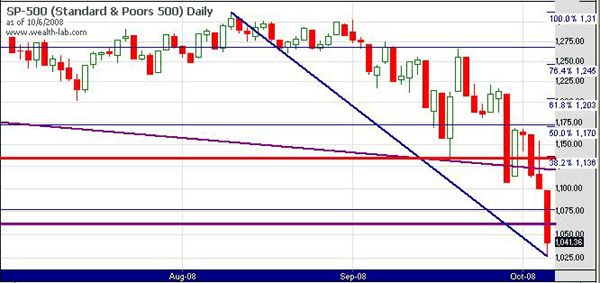
| So what do we do now? Although the plummet over today and the last few weeks may not be completely out of steam, we are approaching a point where nimble traders can close out short positions and look to establish short-term long positions. Assuming we do get a bounce quickly, the chart will look something like Figure 2: |

|
| FIGURE 2: S&P 500, DAILY. Assuming a bounce arrives quickly, the resulting chart will look something like this one. |
| Graphic provided by: Wealth-lab. |
| |
| Given that we are still in a primary bear market, I suspect that any bounce we get will be short-lived. There are a few levels of resistance that the market will have to pass through on the way up. First will be the purple downward-sloping trendline, although I doubt this will be hard to surpass. The second is found by drawing a Fibonacci retracement between the August 2008 highs and the recent low for today; note that the 38.2% retracement level is right around 1136. This coincides with the September 18th low at 1133, which has turned from support into resistance (red line). The 50% retracement level will also be significant resistance because it is at almost the same level as the 50% support level shown on Figure 1 in green. Finally, should the S&P manage to surpass all those hurdles, it will then reach the 61.8% retracement level. This price level at 1203 also coincides with the July 15th low at 1200, which now acts as resistance instead of support. |
| Although I suspect that something will materialize shortly to push the markets higher, any bounce will have a number of significant resistance levels to push through before we could begin to think of taking long-term bullish positions. I would treat this as a good trading opportunity and a chance to reestablish short positions for the resumption of a move down. |
Mr. Kupfer is a market professional and amateur stock market commentator. Disclosure: It is likely that Mr. Kupfer has or will enter a position in any security he writes about.
Click here for more information about our publications!
Comments
Date: 10/12/08Rank: 4Comment:

Request Information From Our Sponsors
- StockCharts.com, Inc.
- Candle Patterns
- Candlestick Charting Explained
- Intermarket Technical Analysis
- John Murphy on Chart Analysis
- John Murphy's Chart Pattern Recognition
- John Murphy's Market Message
- MurphyExplainsMarketAnalysis-Intermarket Analysis
- MurphyExplainsMarketAnalysis-Visual Analysis
- StockCharts.com
- Technical Analysis of the Financial Markets
- The Visual Investor
- VectorVest, Inc.
- Executive Premier Workshop
- One-Day Options Course
- OptionsPro
- Retirement Income Workshop
- Sure-Fire Trading Systems (VectorVest, Inc.)
- Trading as a Business Workshop
- VectorVest 7 EOD
- VectorVest 7 RealTime/IntraDay
- VectorVest AutoTester
- VectorVest Educational Services
- VectorVest OnLine
- VectorVest Options Analyzer
- VectorVest ProGraphics v6.0
- VectorVest ProTrader 7
- VectorVest RealTime Derby Tool
- VectorVest Simulator
- VectorVest Variator
- VectorVest Watchdog
