HOT TOPICS LIST
- MACD
- Fibonacci
- RSI
- Gann
- ADXR
- Stochastics
- Volume
- Triangles
- Futures
- Cycles
- Volatility
- ZIGZAG
- MESA
- Retracement
- Aroon
INDICATORS LIST
LIST OF TOPICS
PRINT THIS ARTICLE
by Koos van der Merwe
Is gold to be used as a hedge against inflation?
Position: N/A
Koos van der Merwe
Has been a technical analyst since 1969, and has worked as a futures and options trader with First Financial Futures in Johannesburg, South Africa.
PRINT THIS ARTICLE
GANN
What W.D. Gann Says About Gold
10/06/08 01:18:53 PMby Koos van der Merwe
Is gold to be used as a hedge against inflation?
Position: N/A
| In today's volatile and uncertain market, one questions the role of gold. Is gold to be used as a hedge against inflation? Is gold a hedge against political or financial instability? Will gold rise as a hedge against a rise in the price of oil? Recent events have shown that it will, but what happens if the price of oil falls, as it is falling at the moment, and banks start failing, resulting in the international and national financial crises we are experiencing? It's a contradiction. Will demand for gold increase as the financial crisis reaches a critical level, or will the fall in the price of oil act as a deterrent and cause gold to fall in price? These are questions William Gann asked more than 100 years ago. Gann also said that we should study the long-term charts -- ie, weekly and monthly charts to determine the trend, and then use the daily chart to finalize the entry point. For this reason, Figure 1 is a weekly chart. I have chosen weekly above monthly because of time constraints; March 2001 was the low price for gold. W.D. Gann was obsessed with the study of price and time. Gann believed that we must deal with all aspects of a trading system to be successful in any market speculation. He believed that timing is the most important factor, and that precise timing resulted in maximum profits. Because of this, price must be closely interrelated to time. |

|
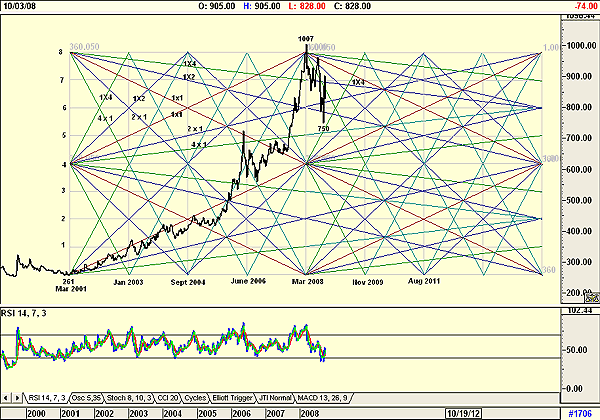
| FIGURE 1: GOLD, WEEKLY, WITH GANN SQUARES |
| Graphic provided by: AdvancedGET. |
| |
| Figure 1 shows Gann squares based on the 360-degree circle parameter, from the low of $261 on March 2001. The square identified the high of $1,007 of March 2008. The chart also identified the high of January 2003 and June 2006 within a one-month margin of error. Figure 1 shows how the gold price rose from a low of $261 in March 2001 to a high of $1,007 in March 2008. This price increase, we believe, was caused by the dramatic rise in the price of oil. As the oil price dropped to nonspeculative levels, so did the price of gold. Now, however, with banks failing and the advent of a national financial crisis, gold should start rising. The chart suggests that this has already started happening as the price of gold started rising from the $750 level, with all the appearance of support on the 2 x 1 Gann line. The chart also divides the range into eight periods and suggests that the gold price may have found support between periods 5 and 6, with resistance at period 7. This does suggest that gold should rise to retest the resistance on the 1x4 Gann line at the period 7 resistance. This is confirmed by the relative strength index (RSI), which is oversold and is suggesting a buy signal. To identify a more precise point, I turn to a daily chart. |

|
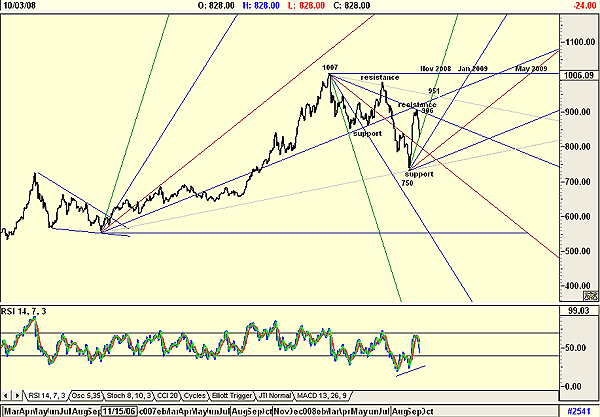
| FIGURE 2: GOLD, DAILY, WITH GANN FANS |
| Graphic provided by: AdvancedGET. |
| |
| On the daily chart (Figure 2), I have drawn Gann fans with a 1.5 parameter taking the low of the falling wedge as my base, as shown on the chart. Both the 2 x 1 and 4 x 1 angles acted as support levels. The chart is suggesting that the gold price should rise and test the $906 level, rising to $951 before finding further resistance. This is confirmed by the RSI, which gave a divergent buy signal, and is now correcting before signaling a further rise. To conclude, weekly charts of gold based on Gann squares is suggesting strength. This is confirmed by daily charts using Gann angles. Possible dates are November 2008, January 2009, and May 2009. Gann always said that we should analyze the weekly and monthly charts to determine the trend, and use the daily chart to enter the market. I would be a buyer of gold at present levels, but watch carefully as the price reaches the various Gann lines and dates for resistance. |
Has been a technical analyst since 1969, and has worked as a futures and options trader with First Financial Futures in Johannesburg, South Africa.
| Address: | 3256 West 24th Ave |
| Vancouver, BC | |
| Phone # for sales: | 6042634214 |
| E-mail address: | petroosp@gmail.com |
Click here for more information about our publications!
Comments
Date: 10/07/08Rank: 5Comment:
Date: 10/07/08Rank: 3Comment:

|

Request Information From Our Sponsors
- StockCharts.com, Inc.
- Candle Patterns
- Candlestick Charting Explained
- Intermarket Technical Analysis
- John Murphy on Chart Analysis
- John Murphy's Chart Pattern Recognition
- John Murphy's Market Message
- MurphyExplainsMarketAnalysis-Intermarket Analysis
- MurphyExplainsMarketAnalysis-Visual Analysis
- StockCharts.com
- Technical Analysis of the Financial Markets
- The Visual Investor
- VectorVest, Inc.
- Executive Premier Workshop
- One-Day Options Course
- OptionsPro
- Retirement Income Workshop
- Sure-Fire Trading Systems (VectorVest, Inc.)
- Trading as a Business Workshop
- VectorVest 7 EOD
- VectorVest 7 RealTime/IntraDay
- VectorVest AutoTester
- VectorVest Educational Services
- VectorVest OnLine
- VectorVest Options Analyzer
- VectorVest ProGraphics v6.0
- VectorVest ProTrader 7
- VectorVest RealTime Derby Tool
- VectorVest Simulator
- VectorVest Variator
- VectorVest Watchdog
