HOT TOPICS LIST
- MACD
- Fibonacci
- RSI
- Gann
- ADXR
- Stochastics
- Volume
- Triangles
- Futures
- Cycles
- Volatility
- ZIGZAG
- MESA
- Retracement
- Aroon
INDICATORS LIST
LIST OF TOPICS
PRINT THIS ARTICLE
by Koos van der Merwe
September is known as the month the market usually slows down, and October is known as the month for drama. What does a Gann chart say?
Position: Buy
Koos van der Merwe
Has been a technical analyst since 1969, and has worked as a futures and options trader with First Financial Futures in Johannesburg, South Africa.
PRINT THIS ARTICLE
GANN ANGLE
What Has October Got To Do With The Bailout?
10/06/08 09:34:53 AMby Koos van der Merwe
September is known as the month the market usually slows down, and October is known as the month for drama. What does a Gann chart say?
Position: Buy
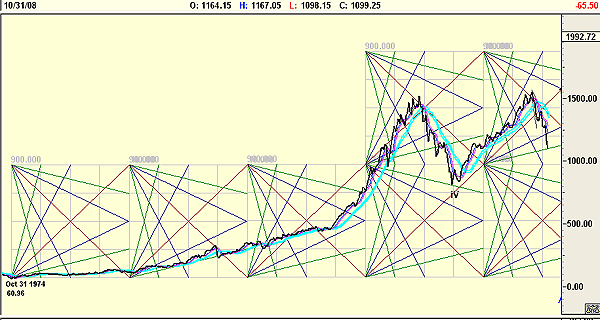
| In the years since the death of WD Gann, many traders have tried to determine exactly what technique he used so successfully to trade the market. His papers, accumulated over a lifetime of study, filled an entire moving van. Many students of Gann have claimed to have found that key, that one secret to his success. These charts shown here highlight one of those secrets. |

|
| FIGURE 1: GANN SQUARES. These Gann squares are at a fixed angle to a square of 90 degrees. |
| Graphic provided by: AdvancedGET. |
| |
| The basis of the angles Gann used came from the 360-degree circle, with the 90-degree angle, a quarter of the circle, as the basis for the well-known Gann angles. Of course, the 90-degree angle is also the basic angle of a square, with the 45-degree angle dividing that square in half. With today's computer technology, the T-square to draw a square and a compass to draw the angle are almost obsolete. One simply draws a line from the low to the high, and computer technology fills in the relative angles. Whether Gann would approve of this technique, and whether the 90-degree exact angle was fixed as a concrete Gann principle, not to be altered, we will never know. |

|
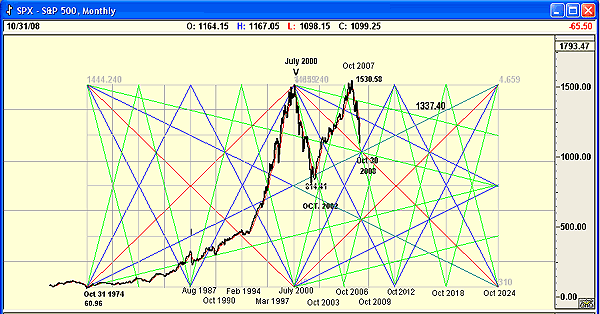
| FIGURE 2: GANN SQUARE. This square is drawn from the low of October 1974 to the high of July 2000. |
| Graphic provided by: AdvancedGET. |
| |
| Figure 1 shows how I have drawn a Gann square from the low of October 1974 to the high of July 2000. Although I have called it a Gann square, it is not truly a square, because the angle of the 1x1 line is not a 90-degree angle. From the high, I have extended the T-square into the future, and was surprised at the result, which takes me to Figure 2, simply an expansion. |

|
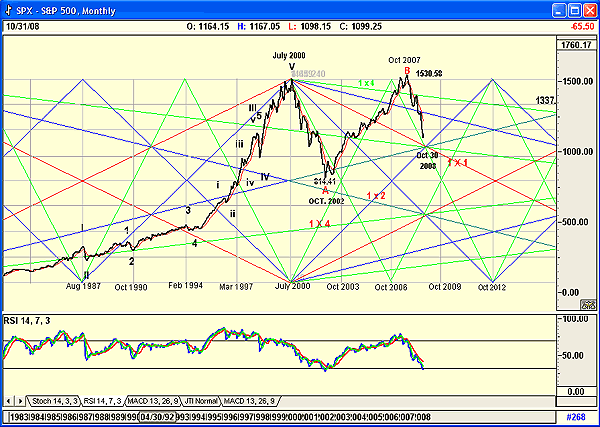
| FIGURE 3: GANN SQUARE PLUS ELLIOTT WAVE SQUARE AND RSI |
| Graphic provided by: AdvancedGET. |
| |
| In Figure 3, I have included an Elliott wave count. Note the following: -The chart identified the crash of 1987. -The chart identified the October 1990 correction and the February 1994 correction, but missed the June 1998 correction. -From the high of July 2000, all the Gann lines have shifted to identifying October as the "it" month. Note October 2003, October 2006, October 2009, and October 2012. Corrections did not occur on the October 2003 or 2006 lines, but did on October 2002 and 2007, an error of a year. Does this mean then that October 2008 as shown on the chart is the month and year for a correction? -Note the confluence of angles at October 2008. -The B-wave shown on the chart is higher than Wave V, suggesting that the C-wave down will be a flat. -Finally, do note the relative strength index (RSI), which is approaching oversold levels. The one-year error in identifying turning points suggested by the Gann lines is telling us that the bailout could be a success, with the bottom of the Standard & Poor's 500 occurring in October 2008 rather than October 2009, as suggested by the Gann line. The confluence of angles at October 2008 with an oversold RSI and the passing of the bailout by Congress on October 3 seems too coincidental to be ignored. With the Elliott wave theory suggesting a C-wave flat, we could well see that correction bottoming. |
Has been a technical analyst since 1969, and has worked as a futures and options trader with First Financial Futures in Johannesburg, South Africa.
| Address: | 3256 West 24th Ave |
| Vancouver, BC | |
| Phone # for sales: | 6042634214 |
| E-mail address: | petroosp@gmail.com |
Click here for more information about our publications!
Comments
Date: 10/07/08Rank: 5Comment:
Date: 10/07/08Rank: 1Comment:
Date: 12/07/08Rank: 5Comment: The medieval art of reasoning provides us with the Earth as center of our visible sector of space, which gives a perfectly useful model for celestial navigation on the surface of our Earth. When we leave that surface to voyage to the Moon or Mars, then we require some additional datum and models in order to provide accurate navigation. The Gann lines as provided here do miss their mark in several of the instances provided to us by the author. For myself, I will need more practice with T-square, protractor and the computer in tandem with the Fibonacci ratios in order to see how these may work together to predict price targets and the measured time lines for those movements in price.

Request Information From Our Sponsors
- StockCharts.com, Inc.
- Candle Patterns
- Candlestick Charting Explained
- Intermarket Technical Analysis
- John Murphy on Chart Analysis
- John Murphy's Chart Pattern Recognition
- John Murphy's Market Message
- MurphyExplainsMarketAnalysis-Intermarket Analysis
- MurphyExplainsMarketAnalysis-Visual Analysis
- StockCharts.com
- Technical Analysis of the Financial Markets
- The Visual Investor
- VectorVest, Inc.
- Executive Premier Workshop
- One-Day Options Course
- OptionsPro
- Retirement Income Workshop
- Sure-Fire Trading Systems (VectorVest, Inc.)
- Trading as a Business Workshop
- VectorVest 7 EOD
- VectorVest 7 RealTime/IntraDay
- VectorVest AutoTester
- VectorVest Educational Services
- VectorVest OnLine
- VectorVest Options Analyzer
- VectorVest ProGraphics v6.0
- VectorVest ProTrader 7
- VectorVest RealTime Derby Tool
- VectorVest Simulator
- VectorVest Variator
- VectorVest Watchdog
