HOT TOPICS LIST
- MACD
- Fibonacci
- RSI
- Gann
- ADXR
- Stochastics
- Volume
- Triangles
- Futures
- Cycles
- Volatility
- ZIGZAG
- MESA
- Retracement
- Aroon
INDICATORS LIST
LIST OF TOPICS
PRINT THIS ARTICLE
by James Kupfer
The Commodity Research Bureau Index is ready for a bounce.
Position: Buy
James Kupfer
Mr. Kupfer is a market professional and amateur stock market commentator. Disclosure: It is likely that Mr. Kupfer has or will enter a position in any security he writes about.
PRINT THIS ARTICLE
CONSUMER PRICE INDEX
CRB Ready To Bounce
10/06/08 08:56:58 AMby James Kupfer
The Commodity Research Bureau Index is ready for a bounce.
Position: Buy
| The CRB Index is a commodity price index made up of 19 commodities traded on the various commodity exchanges. It is composed of four basic groups, each with different weightings. Some examples of commodities tracked by the index include gold, oil, cattle, orange juice, wheat, sugar, and aluminum. |
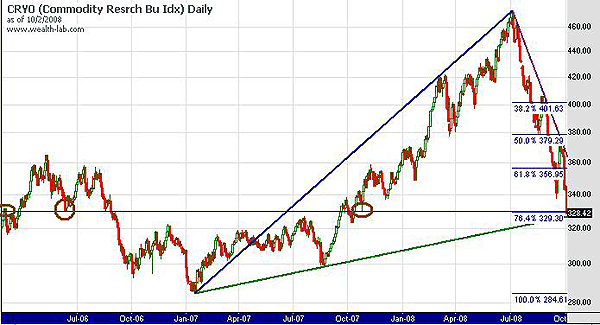
| Since July 2008, the CRB has rapidly deflated, falling from 460 to its current 330 level. It has now reached a convergence of support levels that may help the CRB from falling any further. Taking a look at a longer-term daily chart (Figure 1), you can see a few things. First, based on the January 2007 low to the recent top, we are now right at a 76.4% Fibonacci retracement level. Although this level is not used as commonly at the 38.2%, 50%, and 61.8% levels, it is a useful level, nonetheless. Almost at that exact price level, you can see another blue support line drawn using some historical support and resistance levels that the CRB has clung to (brown circles indicate previous "hits"). Finally, an upward-sloping trendline drawn in green is shown on the chart as well. |

|
| FIGURE 1: CRYO, DAILY. Brown circles indicate previous "hits." The upward-sloping trendline drawn in green is shown as well. |
| Graphic provided by: Wealth-lab. |
| |
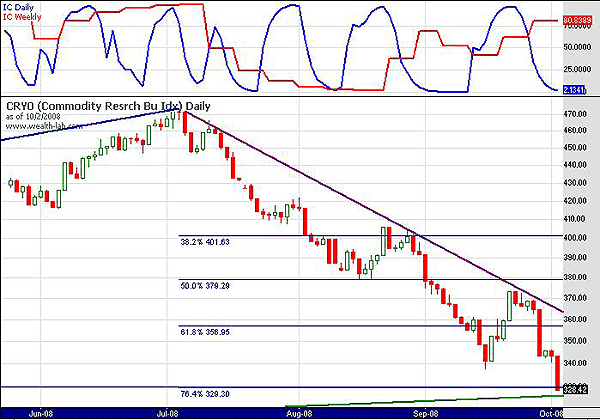
| Zooming in on this chart reveals the convergence a little better. You can also see the daily (blue) and weekly (red) stochastic indicator I favor in the top panel. On the daily level, the CRB is clearly oversold, although on the weekly level it is somewhat overbought. You can clearly see that as of yesterday's close the CRB is within points of each of the other support areas mentioned previously. While this does not mean, of course, that the CRB will bounce, it certainly helps to have all these support levels converging at the same price zone. See Figure 2. |

|
| FIGURE 2: CRYO, DAILY. On the daily level, the CRB is clearly oversold. |
| Graphic provided by: Wealth-lab. |
| |
| While you cannot trade the CRB directly, there are a number of exchange traded fund (ETF) and exchange traded note (ETN) proxies that can provide exposure to the commodities markets tracked by the CRB. Moreover, watching the CRB can provide clues as to what the stock and markets may do. I suggest you keep an eye on the CRB to see what it does here. |
Mr. Kupfer is a market professional and amateur stock market commentator. Disclosure: It is likely that Mr. Kupfer has or will enter a position in any security he writes about.
Click here for more information about our publications!
Comments
Date: 10/07/08Rank: 3Comment:

Request Information From Our Sponsors
- VectorVest, Inc.
- Executive Premier Workshop
- One-Day Options Course
- OptionsPro
- Retirement Income Workshop
- Sure-Fire Trading Systems (VectorVest, Inc.)
- Trading as a Business Workshop
- VectorVest 7 EOD
- VectorVest 7 RealTime/IntraDay
- VectorVest AutoTester
- VectorVest Educational Services
- VectorVest OnLine
- VectorVest Options Analyzer
- VectorVest ProGraphics v6.0
- VectorVest ProTrader 7
- VectorVest RealTime Derby Tool
- VectorVest Simulator
- VectorVest Variator
- VectorVest Watchdog
- StockCharts.com, Inc.
- Candle Patterns
- Candlestick Charting Explained
- Intermarket Technical Analysis
- John Murphy on Chart Analysis
- John Murphy's Chart Pattern Recognition
- John Murphy's Market Message
- MurphyExplainsMarketAnalysis-Intermarket Analysis
- MurphyExplainsMarketAnalysis-Visual Analysis
- StockCharts.com
- Technical Analysis of the Financial Markets
- The Visual Investor
