HOT TOPICS LIST
- MACD
- Fibonacci
- RSI
- Gann
- ADXR
- Stochastics
- Volume
- Triangles
- Futures
- Cycles
- Volatility
- ZIGZAG
- MESA
- Retracement
- Aroon
INDICATORS LIST
LIST OF TOPICS
PRINT THIS ARTICLE
by Alan R. Northam
Retail sales account for two-thirds of the economy. By looking at the retail sector of the stock market we can look into the future and see that the economic plan that Congress has been working on so hard to pass is not a quick fix, and the economy still has further to fall before a recovery is realized.
Position: N/A
Alan R. Northam
Alan Northam lives in the Dallas, Texas area and as an electronic engineer gave him an analytical mind from which he has developed a thorough knowledge of stock market technical analysis. His abilities to analyze the future direction of the stock market has allowed him to successfully trade of his own portfolio over the last 30 years. Mr. Northam is now retired and trading the stock market full time. You can reach him at inquiry@tradersclassroom.com or by visiting his website at http://www.tradersclassroom.com. You can also follow him on Twitter @TradersClassrm.
PRINT THIS ARTICLE
ELLIOTT WAVE
Retail Sector Leads Economy Lower
10/03/08 10:06:21 AMby Alan R. Northam
Retail sales account for two-thirds of the economy. By looking at the retail sector of the stock market we can look into the future and see that the economic plan that Congress has been working on so hard to pass is not a quick fix, and the economy still has further to fall before a recovery is realized.
Position: N/A
| Everyone today has their eyes fixed on the economy and what Congress is doing to fix the problem. However, the actions of Congress are a lagging indicator of the economy and not a leading one. Congress is trying to fix something that has already been broken. It is not necessary to fix something if it is not broken already. The stock market, on the other hand, is a leading indicator of the economy. So if we want to get a glimpse into the future and see what the economy is going to be doing, all we have to do is look at the stock market. The retail sector of the stock market accounts for approximately two-thirds of the economy. So by looking at the retail sector, it is possible to see what we can expect from the economy once Congress passes their economic plan. |
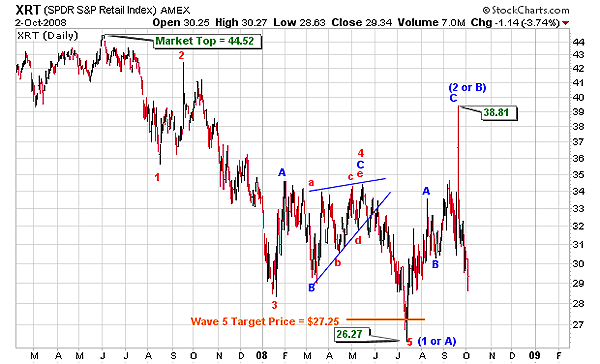
| Figure 1 shows that the retail sector (XRT) made a major market top in early June 2007. Since that time, the retail sector has traded in the downward direction and has formed five completed waves, waves 1, 2, 3, 4, and 5. According to Elliott wave theory, a five-wave move defines the direction of the trend, which in the case of the retail sector is down. Elliott wave theory further says that once a market has completed five waves, it will undergo a market correction in three waves. Again, Figure 1 shows that from mid-June 2008 to late September 2008, the retail sector corrected for its losses from June 2007 in three waves, wave A, B, and C. And finally, Elliott wave theory says that once a corrective wave is complete, the market will resume in the direction of the previous five-wave move, again in the case of the retail sector that direction is down. But how do you know that the downward trend has resumed and that the market correction does not have further to go? To answer this question, all we have to do is look for five waves in the downward direction after wave C. Looking at the daily chart in Figure 1, it is impossible to identify five waves in the downward direction. Therefore, it becomes necessary to look at a smaller time frame. |

|
| FIGURE 1: XRT, DAILY. This chart shows the Elliott wave count. |
| Graphic provided by: StockCharts.com. |
| |
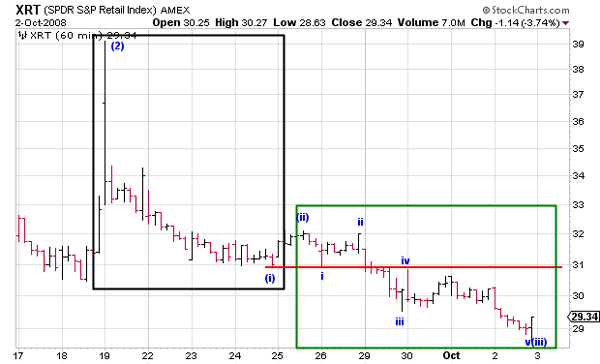
| Figure 2 is that of the 60-minute time frame of the retail sector. In the figure there are two boxes. The black box shows wave (i) down. Wave (i) down should be subdivided by five smaller waves, but they are not clearly identifiable. To identify these five waves, it would be necessary to look at yet a smaller time frame. However, we do not need to go to a smaller time frame. The green box shows wave (iii) down. Wave (iii) is subdivided into five smaller waves that are clearly identifiable. These five waves point in the direction of the trend, which is definitely down. The last bar in Figure 2 shows that the market closed at the top of its range. This could be a signal that wave (iii) is now complete or near completion and that corrective wave (iv) is about to start. Elliott wave theory states that wave 4 cannot cross into the territory of wave 1. Therefore, corrective wave (iv) cannot retrace any higher than the red horizontal line drawn off the price minimum of wave (i). We should look for corrective wave (iv) to end and turn back down before it reaches the price minimum of wave (i). |

|
| FIGURE 2: XRT, 60-MINUTE. This chart shows the Elliott wave count. The Elliott wave count shows five waves in downward direction defining the trend of the retail sector as continuing in the downward direction. |
| Graphic provided by: StockCharts.com. |
| |
| All we need to do now is identify a target price for the next move down. Looking back at Figure 1, note that XRT made a price low in July 2008 and a price high in late September. These are either waves 1 and 2 or A and B, respectively. At this point in the trend, it is not possible to determine the difference. However, if these two waves are A and B, then the expected price target would be in the area of $23.77 per share. If, on the other hand, they are waves 1 and 2, then the next expected price target would be a range of between $14.15 per share to $9.28 per share. Once XRT moves into the area of $23.77 per share and enters into the next corrective rally, it will be possible to look at the wave structure of the corrective rally to determine if the above-mentioned waves are waves A and B or waves 1 and 2. If it is determined that they are waves 1 and 2, then that will signal that XRT has further to go on the downside. If they are waves A and B, then that will signal that the downward move in the retail sector is over. |
| In conclusion, the wave count of XRT indicates that the retail sector still has further to go on the downside. If the wave count is that of waves A and B, then the fall in the retail sector is only half complete. However, if the wave count is waves 1 and 2, then the retail sector has much further to fall before a bottom is reached. Either way, the retail sector of the stock market is pointing the way lower for the economy as we move into the future. |
Alan Northam lives in the Dallas, Texas area and as an electronic engineer gave him an analytical mind from which he has developed a thorough knowledge of stock market technical analysis. His abilities to analyze the future direction of the stock market has allowed him to successfully trade of his own portfolio over the last 30 years. Mr. Northam is now retired and trading the stock market full time. You can reach him at inquiry@tradersclassroom.com or by visiting his website at http://www.tradersclassroom.com. You can also follow him on Twitter @TradersClassrm.
| Garland, Tx | |
| Website: | www.tradersclassroom.com |
| E-mail address: | inquiry@tradersclassroom.com |
Click here for more information about our publications!
PRINT THIS ARTICLE

|

Request Information From Our Sponsors
- StockCharts.com, Inc.
- Candle Patterns
- Candlestick Charting Explained
- Intermarket Technical Analysis
- John Murphy on Chart Analysis
- John Murphy's Chart Pattern Recognition
- John Murphy's Market Message
- MurphyExplainsMarketAnalysis-Intermarket Analysis
- MurphyExplainsMarketAnalysis-Visual Analysis
- StockCharts.com
- Technical Analysis of the Financial Markets
- The Visual Investor
- VectorVest, Inc.
- Executive Premier Workshop
- One-Day Options Course
- OptionsPro
- Retirement Income Workshop
- Sure-Fire Trading Systems (VectorVest, Inc.)
- Trading as a Business Workshop
- VectorVest 7 EOD
- VectorVest 7 RealTime/IntraDay
- VectorVest AutoTester
- VectorVest Educational Services
- VectorVest OnLine
- VectorVest Options Analyzer
- VectorVest ProGraphics v6.0
- VectorVest ProTrader 7
- VectorVest RealTime Derby Tool
- VectorVest Simulator
- VectorVest Variator
- VectorVest Watchdog
