HOT TOPICS LIST
- MACD
- Fibonacci
- RSI
- Gann
- ADXR
- Stochastics
- Volume
- Triangles
- Futures
- Cycles
- Volatility
- ZIGZAG
- MESA
- Retracement
- Aroon
INDICATORS LIST
LIST OF TOPICS
PRINT THIS ARTICLE
by Chaitali Mohile
The NASDAQ Composite has moved below the support line of a triangular formation.
Position: N/A
Chaitali Mohile
Active trader in the Indian stock markets since 2003 and a full-time writer. Trading is largely based upon technical analysis.
PRINT THIS ARTICLE
BREAKOUTS
NASDAQ Composite Breaches Support
10/02/08 01:34:33 PMby Chaitali Mohile
The NASDAQ Composite has moved below the support line of a triangular formation.
Position: N/A
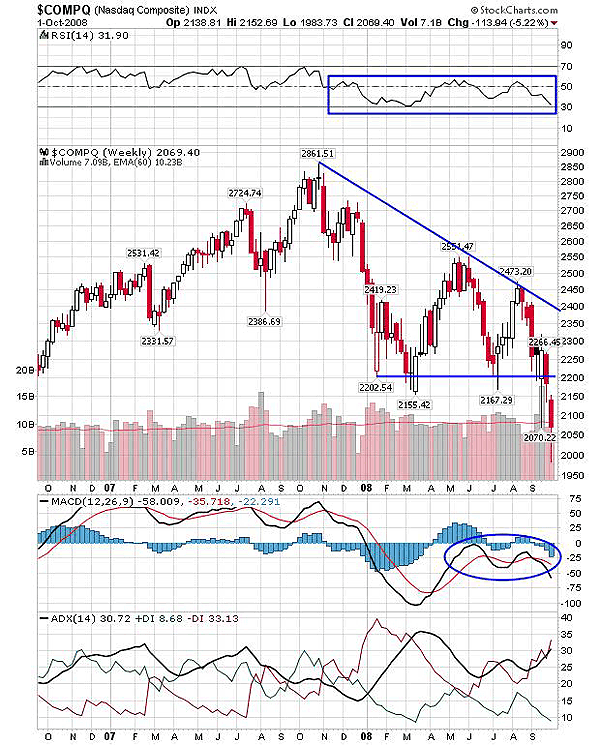
| On the weekly chart (Figure 1), the NASDAQ Composite ($COMPQ) is forming a descending triangle. The three declining highs formed the seller's line, and the buyer's line in this pattern looks like a flat-bottom triangle. This indicates that the sellers are more aggressive than the buyers. In Figure 1, the pattern is being constructed since October 2007 and hence is more reliable. The pattern has not matured, so $COMPQ was likely to move within the range of the upper and lower trendline of the triangle. The range between the two trendlines is wide, so trading within the range was possible following the tight stop-loss. But in the last few days, major financial institutions declared bankruptcy, and various indexes crashed below a strong support zone. $COMPQ was also among those. The index violated the lower trendline support of a descending triangle before maturity. |

|
| FIGURE 1: $COMPQ, WEEKLY. The index has moved below the lower trendline support. The freshly formed resistance would discourage the rally from lower levels. |
| Graphic provided by: StockCharts.com. |
| |
| A descending triangle is a bearish continuation pattern in a downtrend. The potential breakout in this pattern moves in the direction of an existing trend. The average directional movement index (ADX) (14) in Figure 1 shows that $COMPQ has been in a downtrend since early 2008. After the breakdown, the index continued with bearish momentum. The breakout has turned the support line (the buyer's line) of the triangle to resistance, and so, the index may remain under bearish pressure. Earlier, the relative strength index (RSI) (14) in Figure 1 has bounced with the support of 30 levels, and recently, the oscillator has moved toward the same support. Considering this movement, a small bounce can be anticipated, but the freshly formed resistance line may restrict the rally. In addition, the moving average convergence/divergence (MACD) (12,26,9) shows volatile movement in negative territory, and the ADX (14) shows a developing downtrend. |

|
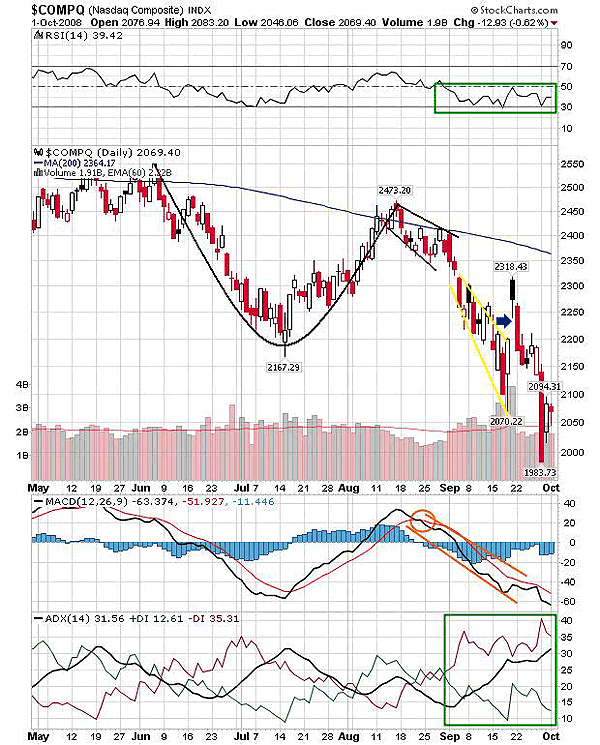
| FIGURE 2: $COMPQ, DAILY. The cup with handle formation failed to move above the 200-day MA resistance. |
| Graphic provided by: StockCharts.com. |
| |
| The cup with handle, a bullish continuation pattern, failed under the resistance of the 200-day moving average (MA) in Figure 2. As a result, $COMPQ plunged to a new low at 2070 with declining volume. Traders may note the sudden increase in volumes with a gap open on September 19. The volume was encouraging for next two days due to an anticipated breakout. But later, the selling pressure increased due to the credit crisis, and the index continued to decline further. The RSI (14) is directionless, and the MACD (12,26,9), after the bearish crossover, has moved sharply in negative territory and shows no bullish signs. The ADX (14) indicates a developed downtrend above 30. |
| The overall situation is highly bearish, and thus, the dark bearish shadows would hover over the NASDAQ Composite. |
Active trader in the Indian stock markets since 2003 and a full-time writer. Trading is largely based upon technical analysis.
| Company: | Independent |
| Address: | C1/3 Parth Indraprasth Towers. Vastrapur |
| Ahmedabad, Guj 380015 | |
| E-mail address: | chaitalimohile@yahoo.co.in |
Traders' Resource Links | |
| Independent has not added any product or service information to TRADERS' RESOURCE. | |
Click here for more information about our publications!
Comments
Date: 10/04/08Rank: 4Comment:

Request Information From Our Sponsors
- StockCharts.com, Inc.
- Candle Patterns
- Candlestick Charting Explained
- Intermarket Technical Analysis
- John Murphy on Chart Analysis
- John Murphy's Chart Pattern Recognition
- John Murphy's Market Message
- MurphyExplainsMarketAnalysis-Intermarket Analysis
- MurphyExplainsMarketAnalysis-Visual Analysis
- StockCharts.com
- Technical Analysis of the Financial Markets
- The Visual Investor
- VectorVest, Inc.
- Executive Premier Workshop
- One-Day Options Course
- OptionsPro
- Retirement Income Workshop
- Sure-Fire Trading Systems (VectorVest, Inc.)
- Trading as a Business Workshop
- VectorVest 7 EOD
- VectorVest 7 RealTime/IntraDay
- VectorVest AutoTester
- VectorVest Educational Services
- VectorVest OnLine
- VectorVest Options Analyzer
- VectorVest ProGraphics v6.0
- VectorVest ProTrader 7
- VectorVest RealTime Derby Tool
- VectorVest Simulator
- VectorVest Variator
- VectorVest Watchdog
