HOT TOPICS LIST
- MACD
- Fibonacci
- RSI
- Gann
- ADXR
- Stochastics
- Volume
- Triangles
- Futures
- Cycles
- Volatility
- ZIGZAG
- MESA
- Retracement
- Aroon
INDICATORS LIST
LIST OF TOPICS
PRINT THIS ARTICLE
by James Kupfer
Meritage Homes appears to be breaking out of a long-term downtrend. Is now the time to buy?
Position: Buy
James Kupfer
Mr. Kupfer is a market professional and amateur stock market commentator. Disclosure: It is likely that Mr. Kupfer has or will enter a position in any security he writes about.
PRINT THIS ARTICLE
BREAKOUTS
Meritage Homing In On A Breakout?
10/01/08 08:40:51 AMby James Kupfer
Meritage Homes appears to be breaking out of a long-term downtrend. Is now the time to buy?
Position: Buy
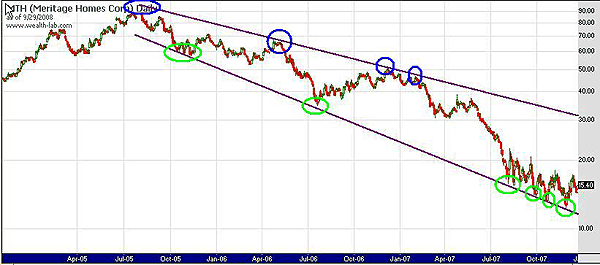
| On the logarithmic daily chart of Meritage Homes (MTH) in Figure 1, you can see the purple trendline established between the top in 2005 and the subsequent lower lows (blue circles) reaching ahead in time until January 2008. By taking that same trendline and fitting it to the bottom of the price action where the green lines are, you can see that MTH was in a very well-formed channel. The lines appear to have a different slope because of the logarithmic setup of the chart. |

|
| FIGURE 1: MTH, DAILY. Here, you can see the trendline established between the top in 2005 and the subsequent lower lows (blue circles) reaching ahead to January 2008. |
| Graphic provided by: Wealth-lab. |
| |
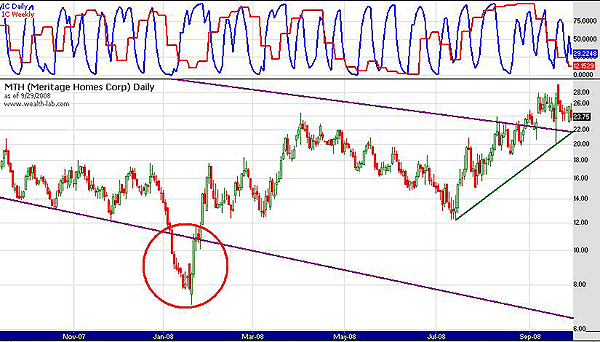
| Moving ahead into 2008, you can see that MTH broke through the bottom channel. However, it subsequently reversed direction and broke back into the old channel and nearly touched the top of the old channel. After a few months of consolidation, MTH has again broken through the channel, but this time to the upside. It has also started to form a new uptrend, underlined in green. See Figure 2. |

|
| FIGURE 2: MTH, DAILY. Moving ahead in 2008, you can see that MTH broke through the bottom channel before it reversed direction and broke back into the old channel and nearly touched the top. |
| Graphic provided by: Wealth-lab. |
| |
| According to my stochastic indicators, MTH is in oversold territory. That, combined with a potential retest of both the old purple downtrend — which now provides price support, not resistance — and the new uptrend would make a purchase somewhere in the $22 range a logical opportunity. Of course, in this highly volatile trading environment, you need to watch your stop-losses more than ever. |
| Disclosure: I am currently long SRS, the UltraShort Real Estate ProShares. |
Mr. Kupfer is a market professional and amateur stock market commentator. Disclosure: It is likely that Mr. Kupfer has or will enter a position in any security he writes about.
Click here for more information about our publications!
Comments
Date: 10/02/08Rank: 3Comment:

Request Information From Our Sponsors
- StockCharts.com, Inc.
- Candle Patterns
- Candlestick Charting Explained
- Intermarket Technical Analysis
- John Murphy on Chart Analysis
- John Murphy's Chart Pattern Recognition
- John Murphy's Market Message
- MurphyExplainsMarketAnalysis-Intermarket Analysis
- MurphyExplainsMarketAnalysis-Visual Analysis
- StockCharts.com
- Technical Analysis of the Financial Markets
- The Visual Investor
- VectorVest, Inc.
- Executive Premier Workshop
- One-Day Options Course
- OptionsPro
- Retirement Income Workshop
- Sure-Fire Trading Systems (VectorVest, Inc.)
- Trading as a Business Workshop
- VectorVest 7 EOD
- VectorVest 7 RealTime/IntraDay
- VectorVest AutoTester
- VectorVest Educational Services
- VectorVest OnLine
- VectorVest Options Analyzer
- VectorVest ProGraphics v6.0
- VectorVest ProTrader 7
- VectorVest RealTime Derby Tool
- VectorVest Simulator
- VectorVest Variator
- VectorVest Watchdog
