HOT TOPICS LIST
- MACD
- Fibonacci
- RSI
- Gann
- ADXR
- Stochastics
- Volume
- Triangles
- Futures
- Cycles
- Volatility
- ZIGZAG
- MESA
- Retracement
- Aroon
INDICATORS LIST
LIST OF TOPICS
PRINT THIS ARTICLE
by Alan R. Northam
Apple, Inc., has now made a 17-month low and is ready for a bounce. Once this market corrective bounce is complete, the stock should head for a price target of $67.60 to $50.70 per share.
Position: N/A
Alan R. Northam
Alan Northam lives in the Dallas, Texas area and as an electronic engineer gave him an analytical mind from which he has developed a thorough knowledge of stock market technical analysis. His abilities to analyze the future direction of the stock market has allowed him to successfully trade of his own portfolio over the last 30 years. Mr. Northam is now retired and trading the stock market full time. You can reach him at inquiry@tradersclassroom.com or by visiting his website at http://www.tradersclassroom.com. You can also follow him on Twitter @TradersClassrm.
PRINT THIS ARTICLE
ELLIOTT WAVE
Apple Hits 17-Month Low
09/30/08 08:45:07 AMby Alan R. Northam
Apple, Inc., has now made a 17-month low and is ready for a bounce. Once this market corrective bounce is complete, the stock should head for a price target of $67.60 to $50.70 per share.
Position: N/A
| Apple (AAPL) made a bull market top in late December 2007 and has now fallen below its May 2007 price level. This is the lowest price that Apple has traded at for 17 months. Looking at the price chart, we can now see that Apple has made a lower high followed by a lower low, signaling that a downtrend is now in progress. To get up to date on my analysis of Apple, I recommend you read my previous article on AAPL entitled "Apple Selloff Under Way," published 7/23/08. |
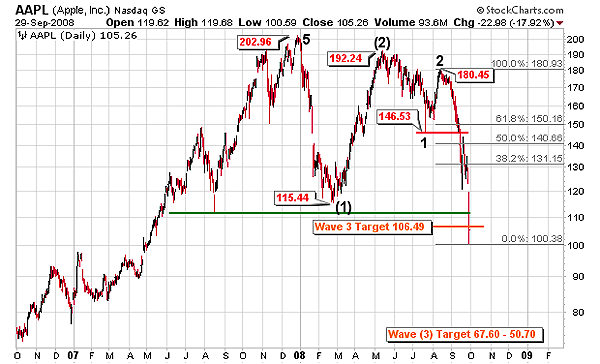
| Looking at the Elliott wave count in Figure 1, AAPL is currently in wave (3) down. Wave (3) down is expected to end at a price level between $67.60 and $50.70, so this wave has further to go before it is complete. Wave (3) is subdividing into five waves of which subwave 3 is also in progress. Apple has now fallen below the target price of $106.49 for wave 3. This signals that wave 3 down could now be complete or should be complete soon. Upon completion of wave 3, Apple will undergo a wave 4 market correction. This correction could take this market up to the 38.2% to 50% Fibonacci retracement level but cannot move higher than $146.53, the wave 1 price minimum. If the market correction does carry above the price minimum of wave 1, then the wave count will have to be re-evaluated. Once corrective wave 4 is complete, the market will head lower again. (I have based these Fibonacci retracement levels on the current market price low. However, if the market does move lower before completing wave 3, then the Fibonacci retracement levels will obviously have to be reestablished.) |
| Once corrective wave 4 is complete, Apple should start moving lower toward its wave (3) target. However, it will not do so in a straight line. There will still be at least three more bear market corrections along the way. And once AAPL reaches its wave (3) target price, the stock will enter into a wave (4) market correction followed by a lower wave (5) price level. Once AAPL completes its wave (4) correction, we will be able to determine a good target price for the completion of wave (5). |

|
| FIGURE 1: AAPL, DAILY. Here's the Elliott wave count and the Fibonacci retracement levels. This chart also shows the price targets for waves 3 and (3). |
| Graphic provided by: StockCharts.com. |
| |
| In conclusion, Apple made a bull market top at the end of 2007 and has been working its way lower ever since. Apple is now expected to rebound in the form of a bear market correction that should not move higher than 146.53. Upon completion of this market correction, AAPL should turn back lower and continue to work itself downward toward the wave (3) target price between 67.60 and 50.70. |
Alan Northam lives in the Dallas, Texas area and as an electronic engineer gave him an analytical mind from which he has developed a thorough knowledge of stock market technical analysis. His abilities to analyze the future direction of the stock market has allowed him to successfully trade of his own portfolio over the last 30 years. Mr. Northam is now retired and trading the stock market full time. You can reach him at inquiry@tradersclassroom.com or by visiting his website at http://www.tradersclassroom.com. You can also follow him on Twitter @TradersClassrm.
| Garland, Tx | |
| Website: | www.tradersclassroom.com |
| E-mail address: | inquiry@tradersclassroom.com |
Click here for more information about our publications!
Comments
Date: 10/02/08Rank: 4Comment:

Request Information From Our Sponsors
- StockCharts.com, Inc.
- Candle Patterns
- Candlestick Charting Explained
- Intermarket Technical Analysis
- John Murphy on Chart Analysis
- John Murphy's Chart Pattern Recognition
- John Murphy's Market Message
- MurphyExplainsMarketAnalysis-Intermarket Analysis
- MurphyExplainsMarketAnalysis-Visual Analysis
- StockCharts.com
- Technical Analysis of the Financial Markets
- The Visual Investor
- VectorVest, Inc.
- Executive Premier Workshop
- One-Day Options Course
- OptionsPro
- Retirement Income Workshop
- Sure-Fire Trading Systems (VectorVest, Inc.)
- Trading as a Business Workshop
- VectorVest 7 EOD
- VectorVest 7 RealTime/IntraDay
- VectorVest AutoTester
- VectorVest Educational Services
- VectorVest OnLine
- VectorVest Options Analyzer
- VectorVest ProGraphics v6.0
- VectorVest ProTrader 7
- VectorVest RealTime Derby Tool
- VectorVest Simulator
- VectorVest Variator
- VectorVest Watchdog
