HOT TOPICS LIST
- MACD
- Fibonacci
- RSI
- Gann
- ADXR
- Stochastics
- Volume
- Triangles
- Futures
- Cycles
- Volatility
- ZIGZAG
- MESA
- Retracement
- Aroon
INDICATORS LIST
LIST OF TOPICS
PRINT THIS ARTICLE
by Chaitali Mohile
The NYSE Composite Index has broken the bearish flag & pennant pattern.
Position: N/A
Chaitali Mohile
Active trader in the Indian stock markets since 2003 and a full-time writer. Trading is largely based upon technical analysis.
PRINT THIS ARTICLE
FLAGS AND PENNANTS
NYSE Composite Index Breaks Down Further
09/26/08 12:46:17 PMby Chaitali Mohile
The NYSE Composite Index has broken the bearish flag & pennant pattern.
Position: N/A
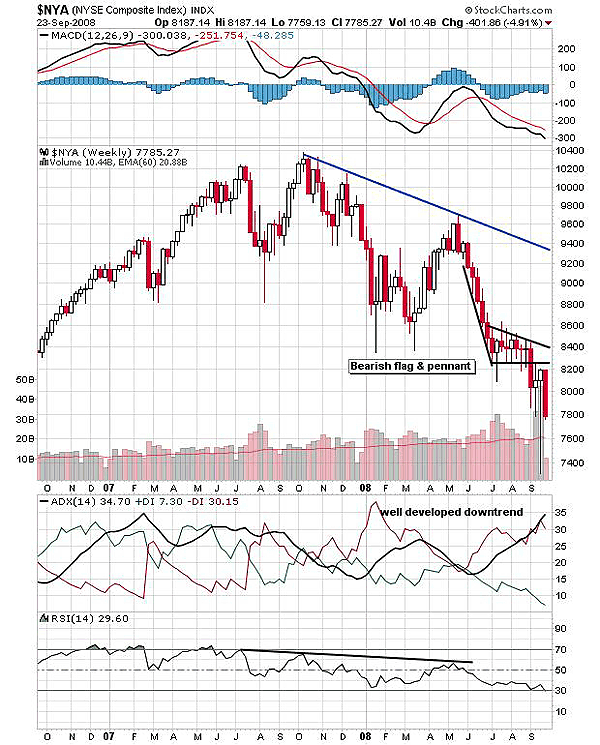
| The NYSE Composite Index has been forming lower highs since October 2007, gradually entering an intermediate downtrend. From the third lower high at 9600, $NYA took a nosedive. The index lost more than 1,200 points during this decline and entered sideways action. The consolidation range narrowed further, forming the bearish flag & pennant pattern. This pattern is a continuation of an existing downside move as the pattern breaks in a downward direction. $NYA consolidated for approximately eight weeks. The volume during consolidation has also been reduced. In Figure 1, the index has already broken down from the bearish continuation pattern. |
| After this breakout, the possibility of the pullback looks difficult as the strong support of previous low of 2007 is also breached. The target can be calculated by measuring the length of the declining rally and subtracting it from the breakout level. Therefore, the length is 9600 - 8200 = 1400; subtracting 1400 from the breakout level at 8200, we get the target of 6800. The moving average convergence/divergence (MACD) (12,26,9) is in negative territory, and the average directional movement index (ADX) (14) is also bearish. The downtrend is well developed with high selling pressure, so the trend would continue to move further. The relative strength index (RSI) (14) lacks strength to initiate any bullish action. Hence, all the indicators are highly bearish. |

|
| FIGURE 1: $NYA, WEEKLY. This chart shows the breakdown of a bearish flag & pennant pattern. |
| Graphic provided by: StockCharts.com. |
| |
| According to Figure 1, the low made in the second week of September 2008 was 7400. So the next potential support for the descending rally would be 7400, and after violating this support the target can be achieved. Considering the bearish indicators, the target looks achievable. In addition, the current problems in the US economy would add weakness and drag the index lower. Any pullback rally from the lower levels would be choppy due to support turned to resistance. |
| Thus, the NYSE Composite Index would continue the downward rally and the intermediate downtrend would sustain its momentum. |
Active trader in the Indian stock markets since 2003 and a full-time writer. Trading is largely based upon technical analysis.
| Company: | Independent |
| Address: | C1/3 Parth Indraprasth Towers. Vastrapur |
| Ahmedabad, Guj 380015 | |
| E-mail address: | chaitalimohile@yahoo.co.in |
Traders' Resource Links | |
| Independent has not added any product or service information to TRADERS' RESOURCE. | |
Click here for more information about our publications!
Comments
Date: 10/02/08Rank: 2Comment:

Request Information From Our Sponsors
- StockCharts.com, Inc.
- Candle Patterns
- Candlestick Charting Explained
- Intermarket Technical Analysis
- John Murphy on Chart Analysis
- John Murphy's Chart Pattern Recognition
- John Murphy's Market Message
- MurphyExplainsMarketAnalysis-Intermarket Analysis
- MurphyExplainsMarketAnalysis-Visual Analysis
- StockCharts.com
- Technical Analysis of the Financial Markets
- The Visual Investor
- VectorVest, Inc.
- Executive Premier Workshop
- One-Day Options Course
- OptionsPro
- Retirement Income Workshop
- Sure-Fire Trading Systems (VectorVest, Inc.)
- Trading as a Business Workshop
- VectorVest 7 EOD
- VectorVest 7 RealTime/IntraDay
- VectorVest AutoTester
- VectorVest Educational Services
- VectorVest OnLine
- VectorVest Options Analyzer
- VectorVest ProGraphics v6.0
- VectorVest ProTrader 7
- VectorVest RealTime Derby Tool
- VectorVest Simulator
- VectorVest Variator
- VectorVest Watchdog
