HOT TOPICS LIST
- MACD
- Fibonacci
- RSI
- Gann
- ADXR
- Stochastics
- Volume
- Triangles
- Futures
- Cycles
- Volatility
- ZIGZAG
- MESA
- Retracement
- Aroon
INDICATORS LIST
LIST OF TOPICS
PRINT THIS ARTICLE
by Alan R. Northam
The Financials Select Sector SPDR (XLF) made a market top in May 2007 and has been trading in an ABC zigzag market correction pattern since. It now appears that XLF has started the last leg down of the market correction that is correcting the previous complete bull market.
Position: N/A
Alan R. Northam
Alan Northam lives in the Dallas, Texas area and as an electronic engineer gave him an analytical mind from which he has developed a thorough knowledge of stock market technical analysis. His abilities to analyze the future direction of the stock market has allowed him to successfully trade of his own portfolio over the last 30 years. Mr. Northam is now retired and trading the stock market full time. You can reach him at inquiry@tradersclassroom.com or by visiting his website at http://www.tradersclassroom.com. You can also follow him on Twitter @TradersClassrm.
PRINT THIS ARTICLE
ELLIOTT WAVE
Financials Start Last Leg Down
09/26/08 12:42:05 PMby Alan R. Northam
The Financials Select Sector SPDR (XLF) made a market top in May 2007 and has been trading in an ABC zigzag market correction pattern since. It now appears that XLF has started the last leg down of the market correction that is correcting the previous complete bull market.
Position: N/A
| According to the Elliott wave principles, after a market makes a market top it will correct in three waves. These three waves are labeled waves A, B, and C. Wave A retraces or corrects the first part of the total progress made by the previous trend. Wave B then moves in the direction of the previous trend and corrects part of wave A. Wave C moves in the opposite direction as the previous trend and completes the corrective process. Elliott calls this an ABC zigzag wave pattern. Further, wave A normally unfolds in five subwaves, wave B normally forms a smaller ABC zigzag, and the final wave C also unfolds in five subwaves. |
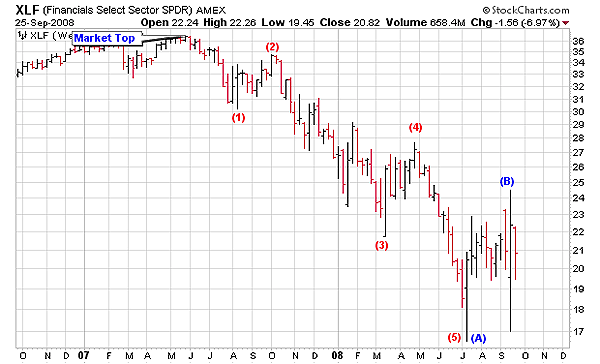
| Figure 1 shows the weekly bar chart of XLF. This chart shows that XLF made a major market top in late May 2007 after completing a bull market runup from mid-2002. This chart also shows that XLF has since sold off in five waves, completing wave (A) of an ABC zigzag corrective pattern that is correcting the complete previous bull market runup. Figure 1 also shows wave (B) to be complete as well. In Figure 2, the details of the (B) substructure is shown. |

|
| FIGURE 1: XLF, WEEKLY. This chart shows five waves down. According to RN Elliott, the first five waves define the direction of the next larger trend, which in the case of XLF is down. This chart also shows that these five waves down also form wave (A) of an ABC zigzag market correction. |
| Graphic provided by: StockCharts.com. |
| |
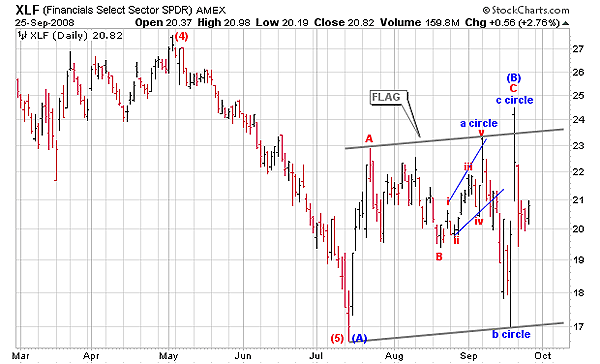
| Figure 2 is that of the daily bar chart for XLF. This chart shows the detail of wave (B) of the ABC zigzag correction. In this figure, note that wave (B) is made up of an ABC zigzag, which is a normal wave pattern for wave B. In addition, wave C of wave (B) has further subdivided into an abc extended flat labeled a circle, b circle, and c circle. From a more traditional technical analysis point of view, the ABC corrective wave structure may look more like a wide flag flying at half-mast or a corrective trading channel. |

|
| FIGURE 2: XLF, DAILY. This chart shows the detail of wave (B) of the ABC zigzag market correction. Since all the subdivisions of wave (B) have been identified, wave (B) is now complete. |
| Graphic provided by: StockCharts.com. |
| |
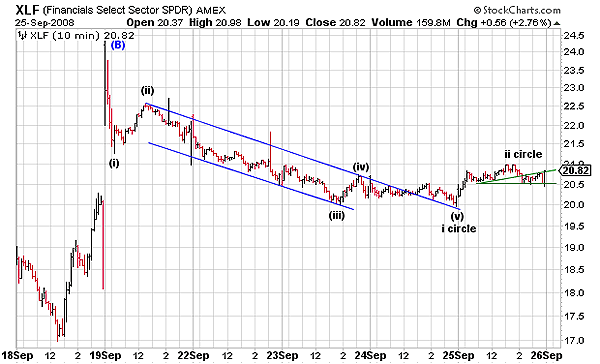
| If wave (B) is now complete as the wave structure suggests, then XLF is now starting the final wave (C) down. Wave (C) down should unfold in five waves similar to wave (A). Once wave (C) is complete, then the complete bear market ABC zigzag correction will be complete. To build a case that wave (C) down has already started, here's the 10-minute chart in Figure 3. Figure 3 shows the 10-minute bar chart of XLF from the start of wave (C) down. This chart shows that this market has now formed five waves to the downside and are labeled waves (i), (ii), (iii), (iv), and (v). These five waves are in the same direction as the five subwaves of wave (A) and therefore signal that the downward trend has resumed. During market corrections, waves A and B also contain five subwaves. However, during market corrections, these five subwaves move in the opposite direction to the main trend. This is one way of identifying the start of a market correction. Likewise, we can identify when the market correction is over and the main trend has resumed by looking for a five-wave move in the direction of the main trend, which in our case is down since wave (A) is pointing down. |

|
| FIGURE 3: XLF, 10-MINUTE. This chart shows five waves in the direction of the main direction of the ABC zigzag market correction. These five waves signal that wave (C), the final leg down of the ABC zigzag market correction, has resumed. |
| Graphic provided by: StockCharts.com. |
| |
| In conclusion, through the use of Elliott wave analysis, it looks like the Financial Select SPDR has now completed waves (A) and (B) of an ABC zigzag market correction that is correcting the previous bull market in the financial sector. It further looks like the final leg down, wave (C), is just getting started. A close below wave (A) will confirm that this final leg down is truly under way. However, a close above wave (B) will signal that wave (B) is not yet completed. |
Alan Northam lives in the Dallas, Texas area and as an electronic engineer gave him an analytical mind from which he has developed a thorough knowledge of stock market technical analysis. His abilities to analyze the future direction of the stock market has allowed him to successfully trade of his own portfolio over the last 30 years. Mr. Northam is now retired and trading the stock market full time. You can reach him at inquiry@tradersclassroom.com or by visiting his website at http://www.tradersclassroom.com. You can also follow him on Twitter @TradersClassrm.
| Garland, Tx | |
| Website: | www.tradersclassroom.com |
| E-mail address: | inquiry@tradersclassroom.com |
Click here for more information about our publications!
Comments
Date: 10/02/08Rank: 5Comment:

Request Information From Our Sponsors
- StockCharts.com, Inc.
- Candle Patterns
- Candlestick Charting Explained
- Intermarket Technical Analysis
- John Murphy on Chart Analysis
- John Murphy's Chart Pattern Recognition
- John Murphy's Market Message
- MurphyExplainsMarketAnalysis-Intermarket Analysis
- MurphyExplainsMarketAnalysis-Visual Analysis
- StockCharts.com
- Technical Analysis of the Financial Markets
- The Visual Investor
- VectorVest, Inc.
- Executive Premier Workshop
- One-Day Options Course
- OptionsPro
- Retirement Income Workshop
- Sure-Fire Trading Systems (VectorVest, Inc.)
- Trading as a Business Workshop
- VectorVest 7 EOD
- VectorVest 7 RealTime/IntraDay
- VectorVest AutoTester
- VectorVest Educational Services
- VectorVest OnLine
- VectorVest Options Analyzer
- VectorVest ProGraphics v6.0
- VectorVest ProTrader 7
- VectorVest RealTime Derby Tool
- VectorVest Simulator
- VectorVest Variator
- VectorVest Watchdog
