HOT TOPICS LIST
- MACD
- Fibonacci
- RSI
- Gann
- ADXR
- Stochastics
- Volume
- Triangles
- Futures
- Cycles
- Volatility
- ZIGZAG
- MESA
- Retracement
- Aroon
INDICATORS LIST
LIST OF TOPICS
PRINT THIS ARTICLE
by Koos van der Merwe
Is the VIX telling us that the bailout plan will be passed by Congress? Is this plan an effective-enough Band-Aid?
Position: Buy
Koos van der Merwe
Has been a technical analyst since 1969, and has worked as a futures and options trader with First Financial Futures in Johannesburg, South Africa.
PRINT THIS ARTICLE
VOLATILITY
The Bailout Plan And The VIX
09/25/08 02:51:12 PMby Koos van der Merwe
Is the VIX telling us that the bailout plan will be passed by Congress? Is this plan an effective-enough Band-Aid?
Position: Buy
| The Chicago Board Options Exchange Volatility Index (VIX), which shows the market's expectation of 30-day volatility, is constructed using the implied volatilities of a range of Standard & Poor's 500 index options. This volatility is meant to be looking forward and is calculated from both calls and puts. The VIX is a widely used measure of market risk and is often referred to as the "investor fear gauge." |

|
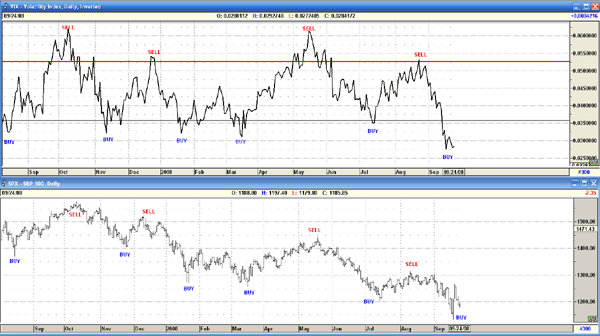
| FIGURE 1: THE VIX INVERTED AND THE S&P 500 |
| Graphic provided by: AdvancedGET. |
| |
| Figure 1 shows an inverted VIX of the S&P 500 as the upper chart and the S&P 500 in the lower chart. The two horizontal lines (black and red) have been drawn in to collect the most bottoms (lows) and tops (highs) of the VIX Index. Observe how the VIX would break the lower horizontal level and on turning up signal a buy, which was justified by the S&P 500 moving higher. Note too how after it penetrated the upper (red) horizontal line, the sell signal was not as defined, but it did warn us that a sell signal was in the offing. At the moment, the VIX of the S&P 500 is signaling a buy, which suggests that Congress will pass the bailout package. The S&P 500 should now start rising. The rate of rise, and the extent of the rise is very much dependent on how long it takes for the wound in the US economy to heal. How effective will the Band-Aid be, and how long will it take for the wound to heal? |
Has been a technical analyst since 1969, and has worked as a futures and options trader with First Financial Futures in Johannesburg, South Africa.
| Address: | 3256 West 24th Ave |
| Vancouver, BC | |
| Phone # for sales: | 6042634214 |
| E-mail address: | petroosp@gmail.com |
Click here for more information about our publications!
PRINT THIS ARTICLE

Request Information From Our Sponsors
- StockCharts.com, Inc.
- Candle Patterns
- Candlestick Charting Explained
- Intermarket Technical Analysis
- John Murphy on Chart Analysis
- John Murphy's Chart Pattern Recognition
- John Murphy's Market Message
- MurphyExplainsMarketAnalysis-Intermarket Analysis
- MurphyExplainsMarketAnalysis-Visual Analysis
- StockCharts.com
- Technical Analysis of the Financial Markets
- The Visual Investor
- VectorVest, Inc.
- Executive Premier Workshop
- One-Day Options Course
- OptionsPro
- Retirement Income Workshop
- Sure-Fire Trading Systems (VectorVest, Inc.)
- Trading as a Business Workshop
- VectorVest 7 EOD
- VectorVest 7 RealTime/IntraDay
- VectorVest AutoTester
- VectorVest Educational Services
- VectorVest OnLine
- VectorVest Options Analyzer
- VectorVest ProGraphics v6.0
- VectorVest ProTrader 7
- VectorVest RealTime Derby Tool
- VectorVest Simulator
- VectorVest Variator
- VectorVest Watchdog
