HOT TOPICS LIST
- MACD
- Fibonacci
- RSI
- Gann
- ADXR
- Stochastics
- Volume
- Triangles
- Futures
- Cycles
- Volatility
- ZIGZAG
- MESA
- Retracement
- Aroon
INDICATORS LIST
LIST OF TOPICS
PRINT THIS ARTICLE
by Arthur Hill
After tracing out an ABC correction, Linear Technology surged with good volume, and this could foreshadow a breakout that ends the correction.
Position: Accumulate
Arthur Hill
Arthur Hill is currently editor of TDTrader.com, a website specializing in trading strategies, sector/industry specific breadth stats and overall technical analysis. He passed the Society of Technical Analysts (STA London) diploma exam with distinction is a Certified Financial Technician (CFTe). Prior to TD Trader, he was the Chief Technical Analyst for Stockcharts.com and the main contributor to the ChartSchool.
PRINT THIS ARTICLE
ELLIOTT WAVE
An ABC Correction For Linear Tech
09/25/08 02:47:38 PMby Arthur Hill
After tracing out an ABC correction, Linear Technology surged with good volume, and this could foreshadow a breakout that ends the correction.
Position: Accumulate
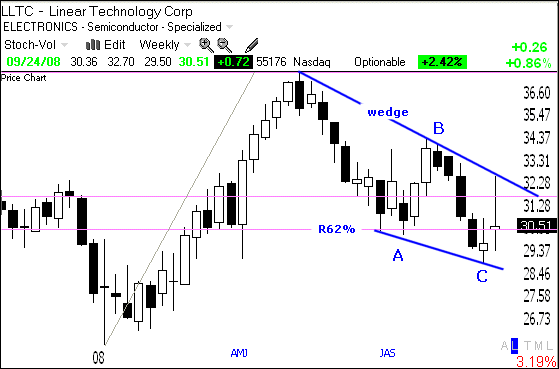
| Figure 1 shows weekly prices with the ABC correction. After a sharp advance, some sort of pullback or consolidation is normal. Linear Technology (LLTC) surged from the mid-20s to the mid-30s and then corrected. According to Elliott wave theory, corrections often form with three waves. Wave A marks the first decline, wave B marks a bounce that forms a lower high, and wave C marks the second decline to new lows. |

|
| FIGURE 1: LLTC, WEEKLY. After a sharp advance, a pullback or consolidation is normal. |
| Graphic provided by: TeleChart2007. |
| |
| Elliott wave theory also suggests that ABC corrections often retrace 62% of the prior advance. The magenta line shows the 62% retracement mark and LLTC firmed near this level over the last two weeks. For now, the downtrend, and hence the correction, remain in place. LLTC needs to exceed the upper trendline to break out of this falling wedge. |

|
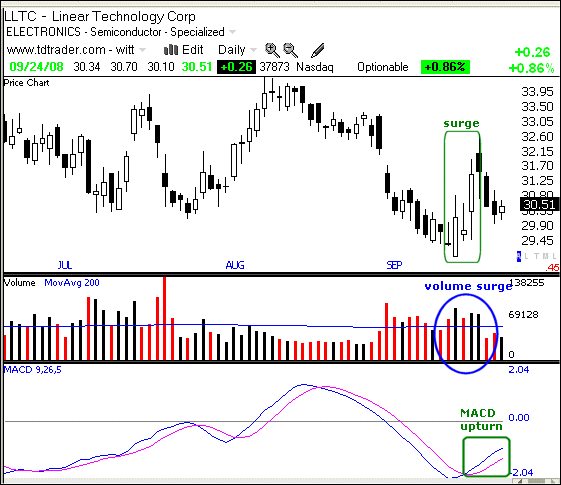
| FIGURE 2: LLTC, DAILY. Even though the correction continues, the stock is showing signs of life. |
| Graphic provided by: TeleChart2007. |
| |
| Even though the correction continues, LLTC is showing signs of life on the daily chart (Figure 2). The stock found support around 30 and surged with three days of big volume. High volume shows strong buying pressure. LLTC then pulled for three days and firmed with a small white candlestick (30.51). This is the moment of truth for LLTC. If the prior surge is worth its weight in volume, then LLTC should hold above the presurge low and continue higher soon. In addition, note that the moving average convergence/divergence (MACD) turned up over the last two weeks and momentum is improving. |
Arthur Hill is currently editor of TDTrader.com, a website specializing in trading strategies, sector/industry specific breadth stats and overall technical analysis. He passed the Society of Technical Analysts (STA London) diploma exam with distinction is a Certified Financial Technician (CFTe). Prior to TD Trader, he was the Chief Technical Analyst for Stockcharts.com and the main contributor to the ChartSchool.
| Title: | Editor |
| Company: | TDTrader.com |
| Address: | Willem Geetsstraat 17 |
| Mechelen, B2800 | |
| Phone # for sales: | 3215345465 |
| Website: | www.tdtrader.com |
| E-mail address: | arthurh@tdtrader.com |
Traders' Resource Links | |
| TDTrader.com has not added any product or service information to TRADERS' RESOURCE. | |
Click here for more information about our publications!
Comments

Request Information From Our Sponsors
- StockCharts.com, Inc.
- Candle Patterns
- Candlestick Charting Explained
- Intermarket Technical Analysis
- John Murphy on Chart Analysis
- John Murphy's Chart Pattern Recognition
- John Murphy's Market Message
- MurphyExplainsMarketAnalysis-Intermarket Analysis
- MurphyExplainsMarketAnalysis-Visual Analysis
- StockCharts.com
- Technical Analysis of the Financial Markets
- The Visual Investor
- VectorVest, Inc.
- Executive Premier Workshop
- One-Day Options Course
- OptionsPro
- Retirement Income Workshop
- Sure-Fire Trading Systems (VectorVest, Inc.)
- Trading as a Business Workshop
- VectorVest 7 EOD
- VectorVest 7 RealTime/IntraDay
- VectorVest AutoTester
- VectorVest Educational Services
- VectorVest OnLine
- VectorVest Options Analyzer
- VectorVest ProGraphics v6.0
- VectorVest ProTrader 7
- VectorVest RealTime Derby Tool
- VectorVest Simulator
- VectorVest Variator
- VectorVest Watchdog
