HOT TOPICS LIST
- MACD
- Fibonacci
- RSI
- Gann
- ADXR
- Stochastics
- Volume
- Triangles
- Futures
- Cycles
- Volatility
- ZIGZAG
- MESA
- Retracement
- Aroon
INDICATORS LIST
LIST OF TOPICS
PRINT THIS ARTICLE
by Chaitali Mohile
The Gold & Silver Index has witnessed a robust corrective phase.
Position: Buy
Chaitali Mohile
Active trader in the Indian stock markets since 2003 and a full-time writer. Trading is largely based upon technical analysis.
PRINT THIS ARTICLE
SUPPORT & RESISTANCE
$XAU Is Undergoing A Relief Rally
09/24/08 12:55:54 PMby Chaitali Mohile
The Gold & Silver Index has witnessed a robust corrective phase.
Position: Buy
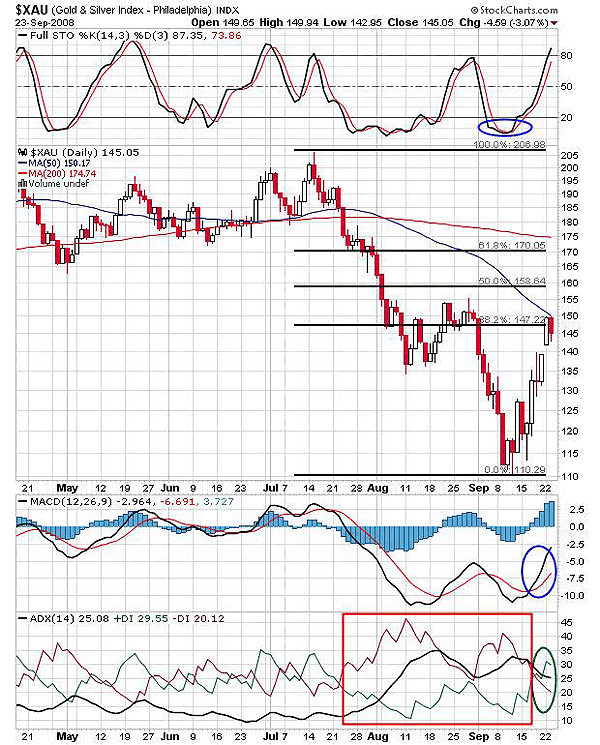
| The correction in the Philadelphia Gold & Silver Index ($XAU) began in July 2008 from its highest level of 206. The stochastic (14,3,3) formed lower highs and the negative divergence to the price movement dragged the index to new lows. $XAU showed no signs of recovery during the autumn. By September 2008, the index reached the lowest level of 105, losing around 100 points. The stochastic (14,3,3) has turned oversold, indicating a fresh move up (see Figure 1). The momentum indicator was oversold earlier as well, but the trend was captured by the bears. So the pullback could not move higher, and the index resumed its downside move. |

|
| FIGURE 1: $XAU, DAILY. The pullback rally has reached 38.2% retracement levels, and the 50-day moving average resistance also reaches the same level. |
| Graphic provided by: StockCharts.com. |
| |
| In Figure 1, the average directional movement index (ADX) (14) shows increasing buying pressure indicated by the positive directional index (+DI), and hence the downtrend may reverse. The moving average convergence/divergence (MACD) (12,26,9) has turned positive after the bullish crossover in negative territory. So along with the stochastic (14,3,3), the other two indicators also suggest a successful pullback rally. The index has already recovered to a 38.2% Fibonacci retracement level, and the 50-day moving average (MA) resistance also went to the same level. In addition, the stochastic (14,3,3) has recently reached a highly overbought area. Thus, the index may undergo minor consolidation or a small decline before resuming its upside move. The next Fibonacci retracement level of 50% would be the target after resuming the rally. |
| The traders who are already long can keep a stop-loss at 135, as $XAU could decline. |

|
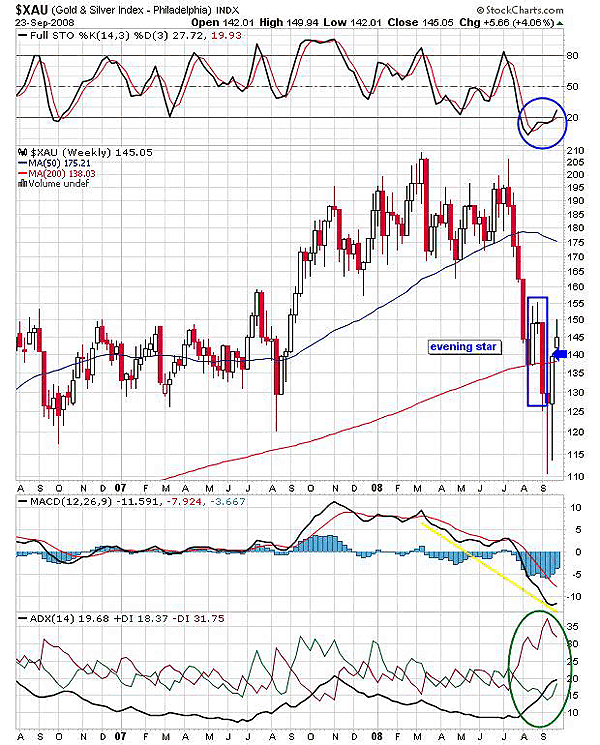
| FIGURE 2: $XAU, WEEKLY. The 200-day MA would help the index reach previous highs. |
| Graphic provided by: StockCharts.com. |
| |
| According to Figure 2, the slump in $XAU failed to establish the support at the 200-day MA. The bearish candle of an evening star reversal candlestick pattern closed far below the support. This indicated bearish pressure, and the next two candles in Figure 2 made new lows under the same resistance. The third bullish candle marginally closed above the 200-day MA, indicating a positive rally was under way. In addition, the stochastic (14,3,3) also surged above the oversold territory. On these bullish notes, the gap opening converted the 200-day MA resistance to support. With the newly formed support, the buying pressure is likely to increase and the fresh uptrend may get developed in Figure 2. The ADX (14) shows declining selling pressure indicated by the negative directional index (-DI), so the pullback is likely to sustain under the current scenario. Although the MACD (12,26,9) is still negative, the other two indicators are bullish toward the relief rally. |
| The rally is likely to violate the 50-day MA resistance and gain the previous higher levels. Traders waiting on the sidelines can initiate fresh buying positions either above the 38.5% Fibonacci retracement level or after 50-day MA resistance is converted to support. |
Active trader in the Indian stock markets since 2003 and a full-time writer. Trading is largely based upon technical analysis.
| Company: | Independent |
| Address: | C1/3 Parth Indraprasth Towers. Vastrapur |
| Ahmedabad, Guj 380015 | |
| E-mail address: | chaitalimohile@yahoo.co.in |
Traders' Resource Links | |
| Independent has not added any product or service information to TRADERS' RESOURCE. | |
Click here for more information about our publications!
PRINT THIS ARTICLE

Request Information From Our Sponsors
- StockCharts.com, Inc.
- Candle Patterns
- Candlestick Charting Explained
- Intermarket Technical Analysis
- John Murphy on Chart Analysis
- John Murphy's Chart Pattern Recognition
- John Murphy's Market Message
- MurphyExplainsMarketAnalysis-Intermarket Analysis
- MurphyExplainsMarketAnalysis-Visual Analysis
- StockCharts.com
- Technical Analysis of the Financial Markets
- The Visual Investor
- VectorVest, Inc.
- Executive Premier Workshop
- One-Day Options Course
- OptionsPro
- Retirement Income Workshop
- Sure-Fire Trading Systems (VectorVest, Inc.)
- Trading as a Business Workshop
- VectorVest 7 EOD
- VectorVest 7 RealTime/IntraDay
- VectorVest AutoTester
- VectorVest Educational Services
- VectorVest OnLine
- VectorVest Options Analyzer
- VectorVest ProGraphics v6.0
- VectorVest ProTrader 7
- VectorVest RealTime Derby Tool
- VectorVest Simulator
- VectorVest Variator
- VectorVest Watchdog
