HOT TOPICS LIST
- MACD
- Fibonacci
- RSI
- Gann
- ADXR
- Stochastics
- Volume
- Triangles
- Futures
- Cycles
- Volatility
- ZIGZAG
- MESA
- Retracement
- Aroon
INDICATORS LIST
LIST OF TOPICS
PRINT THIS ARTICLE
by Chaitali Mohile
The Material SPDR has been under bearish clouds for more than six months. The moving average resistances and the head & shoulder top may suppress any pullback rally.
Position: Sell
Chaitali Mohile
Active trader in the Indian stock markets since 2003 and a full-time writer. Trading is largely based upon technical analysis.
PRINT THIS ARTICLE
SUPPORT & RESISTANCE
The Bearish Force Sustains For XLB
09/23/08 11:11:06 AMby Chaitali Mohile
The Material SPDR has been under bearish clouds for more than six months. The moving average resistances and the head & shoulder top may suppress any pullback rally.
Position: Sell
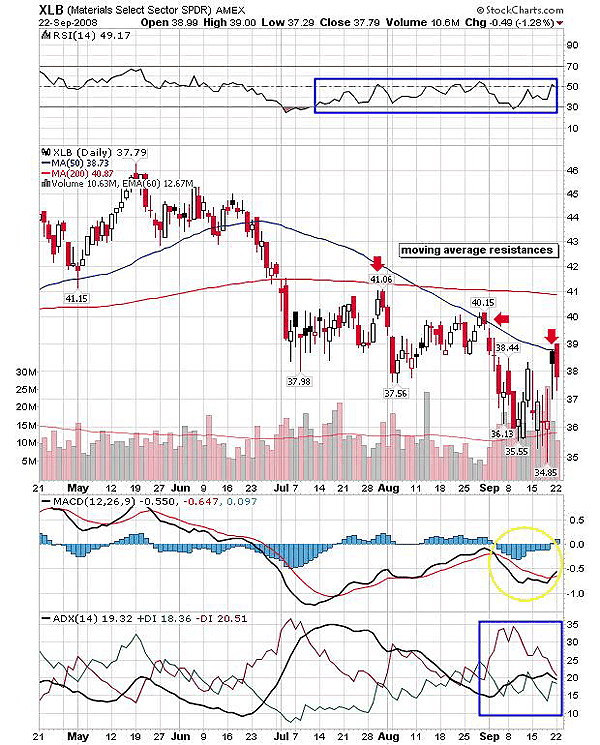
| The breakdown in early July 2007 converted the 200-day moving average (MA) support to strong resistance. The Material Select Sector (XLB) later consolidated under the newly formed resistance of 200-day MA. In addition, the bearish moving average crossover weakened XLB and therefore formed lower highs. In Figure 1, the arrows show the moving average resistances and the price following the declining 50-day MA. Recently, the 50-day MA resistance was challenged for the third time, but the bearish force discouraged the pullback rally. |

|
| FIGURE 1: XLB, DAILY. Here, the arrows show the moving average resistance, and the price following the declining 50-day moving average. |
| Graphic provided by: StockCharts.com. |
| |
| The relative strength index (RSI) (14) since July has failed to sustain above the 50 level. The oscillator moved within the range of 30-50, indicating a lack of strength to pull the index higher. So 50 levels can be considered as a strong resistance for any relief rally. The RSI (14) is back to the same level from the oversold area and ready to decline. The moving average convergence/divergence (MACD) (12,26,9) is in negative territory with a bullish crossover. However, the bullish crossover can attract the buying force only if the indicator moves above the zero line. In addition, the average directional movement index (ADX) (14) shows that the positive directional index (+DI) is below 20, indicating poor buying pressure. Though the negative directional index (-DI) has declined from the higher level, the selling pressure is stronger than the buying pressure. |
| Thus, the resistance and the weakness in indicators on the daily chart is likely to add to the bearish force. |

|
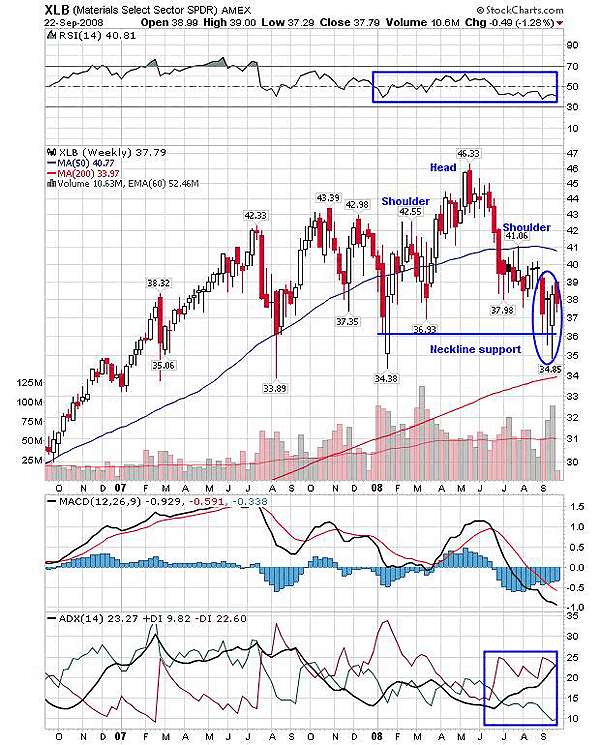
| FIGURE 2: XLB, WEEKLY. See the head & shoulders top pattern being formed with a neckline support at 36. |
| Graphic provided by: StockCharts.com. |
| |
| In Figure 2, we can see the head & shoulders top pattern being formed with a neckline support at 36. The breakdown below the neckline would boost the bears and plunge XLB to lower lows. After the breakdown, the 200-day MA would offer an immediate support. As a result, XLB may surge to retest the neckline resistance. The right shoulder is constructed so the trader has to wait for a pattern breakout before initiating any short positions. The ADX (14) shows a developing downtrend, and the MACD (12,26,9) has declined from positive to negative territory. In addition, the RSI (14) also shows the head & shoulders top (bearish reversal pattern). |
| The major downtrend can be witnessed below the 200-day MA support in Figure 2. XLB would reach the target on breakdown only if this support is violated. The minimum estimated level would be: 46 (head) - 36 (neckline = 10 - 36 = 26. Before opening any short trade, I would request traders to watch the 200-day MA support. Even though the support is established, the bears would continue to hover around XLB and would discard any significant pullback rally. But traders need to be more cautious in such technical conditions. Hence, the scenario points to a constant bearish force in XLB. |
Active trader in the Indian stock markets since 2003 and a full-time writer. Trading is largely based upon technical analysis.
| Company: | Independent |
| Address: | C1/3 Parth Indraprasth Towers. Vastrapur |
| Ahmedabad, Guj 380015 | |
| E-mail address: | chaitalimohile@yahoo.co.in |
Traders' Resource Links | |
| Independent has not added any product or service information to TRADERS' RESOURCE. | |
Click here for more information about our publications!
PRINT THIS ARTICLE

Request Information From Our Sponsors
- StockCharts.com, Inc.
- Candle Patterns
- Candlestick Charting Explained
- Intermarket Technical Analysis
- John Murphy on Chart Analysis
- John Murphy's Chart Pattern Recognition
- John Murphy's Market Message
- MurphyExplainsMarketAnalysis-Intermarket Analysis
- MurphyExplainsMarketAnalysis-Visual Analysis
- StockCharts.com
- Technical Analysis of the Financial Markets
- The Visual Investor
- VectorVest, Inc.
- Executive Premier Workshop
- One-Day Options Course
- OptionsPro
- Retirement Income Workshop
- Sure-Fire Trading Systems (VectorVest, Inc.)
- Trading as a Business Workshop
- VectorVest 7 EOD
- VectorVest 7 RealTime/IntraDay
- VectorVest AutoTester
- VectorVest Educational Services
- VectorVest OnLine
- VectorVest Options Analyzer
- VectorVest ProGraphics v6.0
- VectorVest ProTrader 7
- VectorVest RealTime Derby Tool
- VectorVest Simulator
- VectorVest Variator
- VectorVest Watchdog
