HOT TOPICS LIST
- MACD
- Fibonacci
- RSI
- Gann
- ADXR
- Stochastics
- Volume
- Triangles
- Futures
- Cycles
- Volatility
- ZIGZAG
- MESA
- Retracement
- Aroon
INDICATORS LIST
LIST OF TOPICS
PRINT THIS ARTICLE
by Arthur Hill
Signs of relative strength and increased buying pressure point to a resistance breakout in Weyerhaeuser.
Position: Accumulate
Arthur Hill
Arthur Hill is currently editor of TDTrader.com, a website specializing in trading strategies, sector/industry specific breadth stats and overall technical analysis. He passed the Society of Technical Analysts (STA London) diploma exam with distinction is a Certified Financial Technician (CFTe). Prior to TD Trader, he was the Chief Technical Analyst for Stockcharts.com and the main contributor to the ChartSchool.
PRINT THIS ARTICLE
VOLUME
Weyerhaeuser Pumps Up The Volume
09/18/08 08:30:39 AMby Arthur Hill
Signs of relative strength and increased buying pressure point to a resistance breakout in Weyerhaeuser.
Position: Accumulate
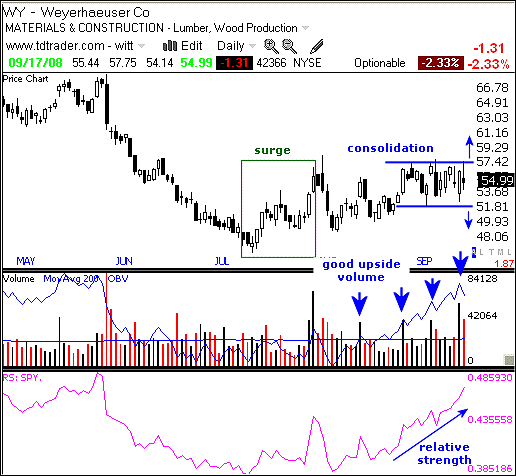
| Weyerhaeuser (WY) is part of the materials sector and the paper-forest products industry group. The stock was hit hard from late May to mid-July with a sharp decline. WY then reversed course around 47–48 and worked its way back above 50 over the last two months. Is this just a corrective advance, or is WY poised for further gains? We could argue either way based on the price chart, but two key indicators point to more strength (see Figure 1). |
| On-balance volume (OBV) surged over the last six weeks as the stock advanced on above average volume. The blue arrows point to four advances with above-average volume. OBV, the blue line, bottomed in early August and moved above its June highs in September. Evidence of strong buying pressure points to further gains in the stock price. |

|
| FIGURE 1: WY, DAILY. The blue arrows point to four advances with above-average volume. |
| Graphic provided by: TeleChart2007. |
| |
| The bottom indicator shows the price relative, which compares the performance of WY to the Standard & Poor's 500 ETF (SPY). The price relative bottomed in early August and surged above its June high in September. While SPY was weak in September, WY held firm and this shows relative strength. |
| On the price chart, the stock surged in July and then consolidated in August–September. This consolidation tightened the last few weeks, but up volume remained strong during the consolidation. A break above consolidation resistance would signal a continuation higher and target further strength toward the mid-60s. Failure to break out and move below consolidation support would be bearish. |
Arthur Hill is currently editor of TDTrader.com, a website specializing in trading strategies, sector/industry specific breadth stats and overall technical analysis. He passed the Society of Technical Analysts (STA London) diploma exam with distinction is a Certified Financial Technician (CFTe). Prior to TD Trader, he was the Chief Technical Analyst for Stockcharts.com and the main contributor to the ChartSchool.
| Title: | Editor |
| Company: | TDTrader.com |
| Address: | Willem Geetsstraat 17 |
| Mechelen, B2800 | |
| Phone # for sales: | 3215345465 |
| Website: | www.tdtrader.com |
| E-mail address: | arthurh@tdtrader.com |
Traders' Resource Links | |
| TDTrader.com has not added any product or service information to TRADERS' RESOURCE. | |
Click here for more information about our publications!
Comments
Date: 09/20/08Rank: 3Comment:

Request Information From Our Sponsors
- StockCharts.com, Inc.
- Candle Patterns
- Candlestick Charting Explained
- Intermarket Technical Analysis
- John Murphy on Chart Analysis
- John Murphy's Chart Pattern Recognition
- John Murphy's Market Message
- MurphyExplainsMarketAnalysis-Intermarket Analysis
- MurphyExplainsMarketAnalysis-Visual Analysis
- StockCharts.com
- Technical Analysis of the Financial Markets
- The Visual Investor
- VectorVest, Inc.
- Executive Premier Workshop
- One-Day Options Course
- OptionsPro
- Retirement Income Workshop
- Sure-Fire Trading Systems (VectorVest, Inc.)
- Trading as a Business Workshop
- VectorVest 7 EOD
- VectorVest 7 RealTime/IntraDay
- VectorVest AutoTester
- VectorVest Educational Services
- VectorVest OnLine
- VectorVest Options Analyzer
- VectorVest ProGraphics v6.0
- VectorVest ProTrader 7
- VectorVest RealTime Derby Tool
- VectorVest Simulator
- VectorVest Variator
- VectorVest Watchdog
