HOT TOPICS LIST
- MACD
- Fibonacci
- RSI
- Gann
- ADXR
- Stochastics
- Volume
- Triangles
- Futures
- Cycles
- Volatility
- ZIGZAG
- MESA
- Retracement
- Aroon
INDICATORS LIST
LIST OF TOPICS
PRINT THIS ARTICLE
by Alan R. Northam
Depending upon how the Fibonacci retracement tool is used, there is a range of possible support areas that could turn the S&P 500 back upward. However, what we need to be looking for is a trend reversal pattern.
Position: N/A
Alan R. Northam
Alan Northam lives in the Dallas, Texas area and as an electronic engineer gave him an analytical mind from which he has developed a thorough knowledge of stock market technical analysis. His abilities to analyze the future direction of the stock market has allowed him to successfully trade of his own portfolio over the last 30 years. Mr. Northam is now retired and trading the stock market full time. You can reach him at inquiry@tradersclassroom.com or by visiting his website at http://www.tradersclassroom.com. You can also follow him on Twitter @TradersClassrm.
PRINT THIS ARTICLE
FIBONACCI
Bear Market Isn't Over Yet
09/17/08 01:51:04 PMby Alan R. Northam
Depending upon how the Fibonacci retracement tool is used, there is a range of possible support areas that could turn the S&P 500 back upward. However, what we need to be looking for is a trend reversal pattern.
Position: N/A
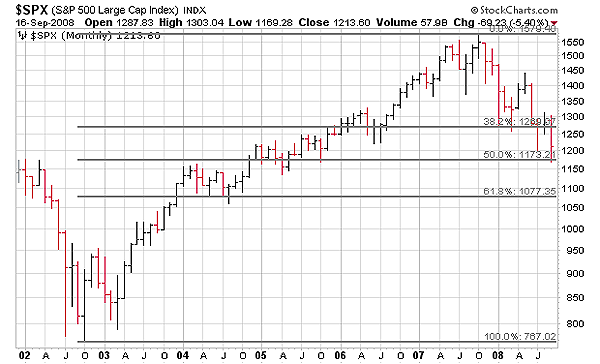
| In 2002 the Standard & Poor's 500 started its final leg up of a bull market that started back in the 1970s and peaked in late 2007. Since that time, the S&P 500 has been trading down. In the media today, I hear voices of hope that the downward trend has reached its limit and the market is ready to resume its upward climb. Traders and market analysts are applying their technical analysis tools to the stock charts in hope of identifying possible areas of major support that will lead to the next great market rally. One such tool is shown in Figure 1. Here, I have applied the Fibonacci retracement tool to the final up leg of the long-term bull market uptrend. The Fibonacci retracement tool when applied to the monthly chart of the S&P 500 shows that this market has not retraced 50% of the upward price movement made since 2002. The 50% retracement area is a typical area of support for market corrections and often precede the next upward move to higher highs. However, if the market continues to correct through the 50% retracement level, then the 61.8% retracement level is the next expected area of support. |

|
| FIGURE 1: SPX, MONTHLY. This bar chart of the S&P 500 showing the Fibonacci retracement levels. |
| Graphic provided by: StockCharts.com. |
| |
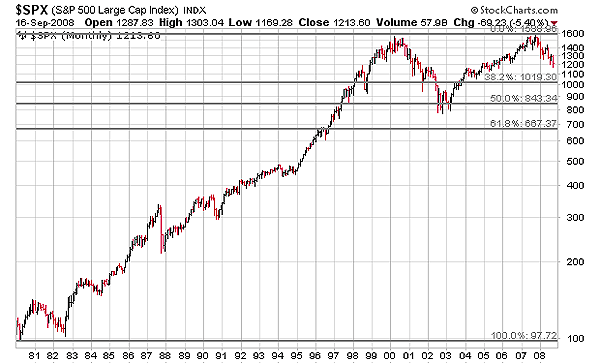
| However, if we were to apply the same Fibonacci retracement tool to the complete bull market uptrend since the 1970s, we would see that the S&P 500 has not yet reached the 38.2% retracement area. This is shown in Figure 2. The areas of possible major support are between 38.2% and 61.8% retracement of the complete rise from the 1970s. |

|
| FIGURE 2: SPX, MONTHLY. This long-term monthly bar chart of the S&P 500 showing the Fibonacci retracement levels. |
| Graphic provided by: StockCharts.com. |
| |
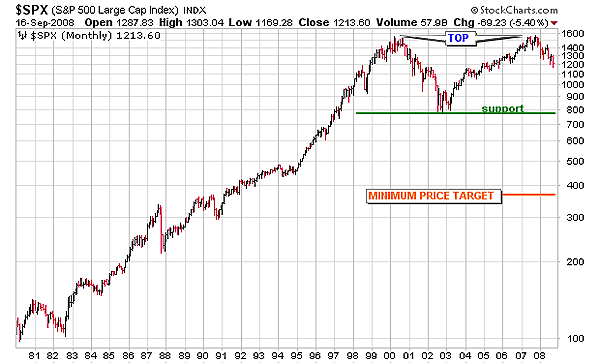
| From these two analyses of the S&P 500, we can see that there are areas of support that could turn the market back upward anywhere from 1200 to as low as 667. However, there is another analysis that can be made that suggests that the S&P 500 could move much lower before the market turns back up. If we look at Figure 3, I have shown a large double-top formation. This figure shows a much lower price target for the S&P 500 before a market bottom can be expected. The price target is arrived at by taking the distance from the highest market top to the minimum price between the two peaks and projecting it downward from the minimum price between the two peaks. |

|
| FIGURE 3: SPX, MONTHLY. Long-term monthly bar chart of the S&P 500 showing a possible large double-top major trend reversal pattern. |
| Graphic provided by: StockCharts.com. |
| |
| So depending upon which market analyses you use, there is a range of possible areas of major support that could turn the S&P 500 back upward. Although these are all valid methods of analysis, what we need to be looking for at these support levels are signs of a trend reversal pattern before we get our hopes up and a trend reversal pattern has not yet developed. So until a reversal pattern does develop, the S&P 500 will continue to sell off. |
Alan Northam lives in the Dallas, Texas area and as an electronic engineer gave him an analytical mind from which he has developed a thorough knowledge of stock market technical analysis. His abilities to analyze the future direction of the stock market has allowed him to successfully trade of his own portfolio over the last 30 years. Mr. Northam is now retired and trading the stock market full time. You can reach him at inquiry@tradersclassroom.com or by visiting his website at http://www.tradersclassroom.com. You can also follow him on Twitter @TradersClassrm.
| Garland, Tx | |
| Website: | www.tradersclassroom.com |
| E-mail address: | inquiry@tradersclassroom.com |
Click here for more information about our publications!
Comments
Date: 09/18/08Rank: 5Comment:

Request Information From Our Sponsors
- StockCharts.com, Inc.
- Candle Patterns
- Candlestick Charting Explained
- Intermarket Technical Analysis
- John Murphy on Chart Analysis
- John Murphy's Chart Pattern Recognition
- John Murphy's Market Message
- MurphyExplainsMarketAnalysis-Intermarket Analysis
- MurphyExplainsMarketAnalysis-Visual Analysis
- StockCharts.com
- Technical Analysis of the Financial Markets
- The Visual Investor
- VectorVest, Inc.
- Executive Premier Workshop
- One-Day Options Course
- OptionsPro
- Retirement Income Workshop
- Sure-Fire Trading Systems (VectorVest, Inc.)
- Trading as a Business Workshop
- VectorVest 7 EOD
- VectorVest 7 RealTime/IntraDay
- VectorVest AutoTester
- VectorVest Educational Services
- VectorVest OnLine
- VectorVest Options Analyzer
- VectorVest ProGraphics v6.0
- VectorVest ProTrader 7
- VectorVest RealTime Derby Tool
- VectorVest Simulator
- VectorVest Variator
- VectorVest Watchdog
