HOT TOPICS LIST
- MACD
- Fibonacci
- RSI
- Gann
- ADXR
- Stochastics
- Volume
- Triangles
- Futures
- Cycles
- Volatility
- ZIGZAG
- MESA
- Retracement
- Aroon
INDICATORS LIST
LIST OF TOPICS
PRINT THIS ARTICLE
by Koos van der Merwe
Lehman Brothers lost hope of being bailed out and was forced to announce bankruptcy.
Position: Sell
Koos van der Merwe
Has been a technical analyst since 1969, and has worked as a futures and options trader with First Financial Futures in Johannesburg, South Africa.
PRINT THIS ARTICLE
REL. STR COMPARATIVE
Could You Have Predicted The Lehman Brothers Disaster?
09/17/08 01:46:02 PMby Koos van der Merwe
Lehman Brothers lost hope of being bailed out and was forced to announce bankruptcy.
Position: Sell
| Lehman Brothers is the latest victim of the subprime crisis. Fundamentally, we know what happened, but if you were a shareholder, could a chart have warned you of its downfall? The current argument is that central banks subscribed to one economic philosophy in an expanding economy and quite another in a contracting economy. When things are going well, markets are left alone. When a crisis develops, however, even the merest hint of one, central bankers respond by cutting interest rates in an attempt to stimulate the economy and prevent asset prices from falling. Efficient market theory at its simplest argues that there can be no bubbles, and that central banks should not intervene to restrain speculative excess. The Federal Reserve chairman at that time, Alan Greenspan, refused to prick the dotcom bubble in 1999 even after warning about "irrational exuberance." Ben Bernanke, the current chairman, appears to have learned his lesson, refusing to cut interest rates on September 16. |

|
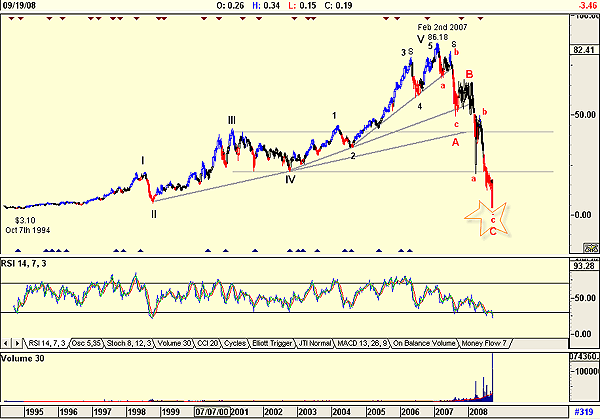
| FIGURE 1: LEHMAN, WEEKLY. This chart of Lehman Brothers shows the sharp market plunge. |
| Graphic provided by: AdvancedGET. |
| |
| So would Lehman Brothers have survived if the market had been left to its own devices? Figure 1 is a weekly chart showing how Lehman rose from a humble $3.10 in October 1994 to a high of $86.18 by February 2007. I have drawn in three support lines, showing how the share price rose almost logarithmically to the high. An Elliott wave count shows a fifth wave that is larger than the third wave, suggesting a strength that we now know was a result of low interest rates resulting in overborrowing, chasing incredible profits. Yes, a correction had to follow, and an abc correction did follow, but the c-wave was not within the fourth wave of lesser degree, a suggestion that this was an abc correction in an A-wave. The first indication that things were not quite what they should have been at Lehman was the fact that the downturn from the fifth-wave high of $86.18 occurred in February 2007, whereas we all know the market only started turning down in July 2007. |

|
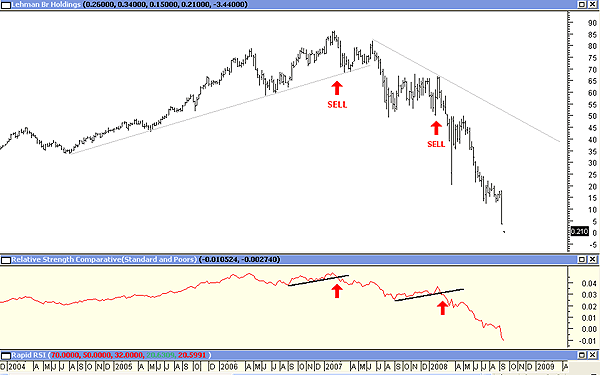
| FIGURE 2: LEHMAN, WEEKLY. This chart of Lehman shows a relative performance indicator and sell signals. |
| Graphic provided by: MetaStock. |
| |
| Figure 2 is therefore a weekly chart of Lehman Brothers with a relative strength indicator to the Standard & Poor's 500 (SPX). On the chart I have highlighted the sell signals given. |

|
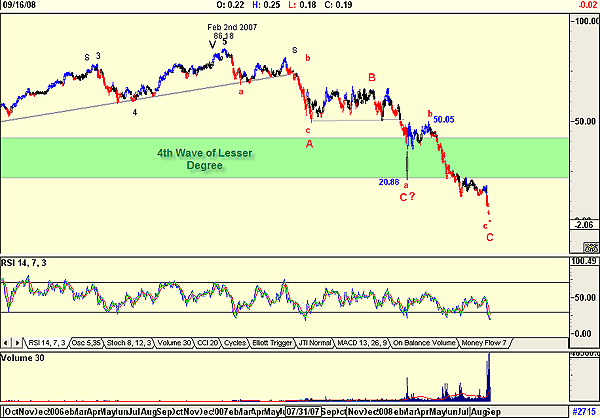
| FIGURE 3: LEHMAN, DAILY. This chart of Lehman shows the increase in volume, on sell signals, and the false buy signals given by the RSI. |
| Graphic provided by: AdvancedGET. |
| |
| Figure 3 is a daily chart, and yes, as you can see from the RSI, a number of buy signals were given on a daily chart, especially the dramatic fall at "a," which many may have taken to be wave C, within the fourth wave of lesser degree. The price fell to a low of $20.88 and corrected upward to $50.05, suggesting strength ahead. There was nothing other than volume in the daily chart to suggest the weakness, resulting in the collapse and subsequent bankruptcy. Volume rose as prices fell, suggesting more sellers than buyers. Michael Carr, in the August 2008 issue of STOCKS & COMMODITIES, wrote an article, "Relative Strength As A Selling Tool." This is the only tool used on Lehman Brothers that would have shown the way. |
Has been a technical analyst since 1969, and has worked as a futures and options trader with First Financial Futures in Johannesburg, South Africa.
| Address: | 3256 West 24th Ave |
| Vancouver, BC | |
| Phone # for sales: | 6042634214 |
| E-mail address: | petroosp@gmail.com |
Click here for more information about our publications!
Comments

Request Information From Our Sponsors
- StockCharts.com, Inc.
- Candle Patterns
- Candlestick Charting Explained
- Intermarket Technical Analysis
- John Murphy on Chart Analysis
- John Murphy's Chart Pattern Recognition
- John Murphy's Market Message
- MurphyExplainsMarketAnalysis-Intermarket Analysis
- MurphyExplainsMarketAnalysis-Visual Analysis
- StockCharts.com
- Technical Analysis of the Financial Markets
- The Visual Investor
- VectorVest, Inc.
- Executive Premier Workshop
- One-Day Options Course
- OptionsPro
- Retirement Income Workshop
- Sure-Fire Trading Systems (VectorVest, Inc.)
- Trading as a Business Workshop
- VectorVest 7 EOD
- VectorVest 7 RealTime/IntraDay
- VectorVest AutoTester
- VectorVest Educational Services
- VectorVest OnLine
- VectorVest Options Analyzer
- VectorVest ProGraphics v6.0
- VectorVest ProTrader 7
- VectorVest RealTime Derby Tool
- VectorVest Simulator
- VectorVest Variator
- VectorVest Watchdog
