HOT TOPICS LIST
- MACD
- Fibonacci
- RSI
- Gann
- ADXR
- Stochastics
- Volume
- Triangles
- Futures
- Cycles
- Volatility
- ZIGZAG
- MESA
- Retracement
- Aroon
INDICATORS LIST
LIST OF TOPICS
PRINT THIS ARTICLE
by Alan R. Northam
The market correction for XHB is over, and this homebuilder index has now resumed its selloff in the direction of its major trend.
Position: N/A
Alan R. Northam
Alan Northam lives in the Dallas, Texas area and as an electronic engineer gave him an analytical mind from which he has developed a thorough knowledge of stock market technical analysis. His abilities to analyze the future direction of the stock market has allowed him to successfully trade of his own portfolio over the last 30 years. Mr. Northam is now retired and trading the stock market full time. You can reach him at inquiry@tradersclassroom.com or by visiting his website at http://www.tradersclassroom.com. You can also follow him on Twitter @TradersClassrm.
PRINT THIS ARTICLE
ELLIOTT WAVE
Homebuilders SPDR Turns Down
09/15/08 09:39:53 AMby Alan R. Northam
The market correction for XHB is over, and this homebuilder index has now resumed its selloff in the direction of its major trend.
Position: N/A
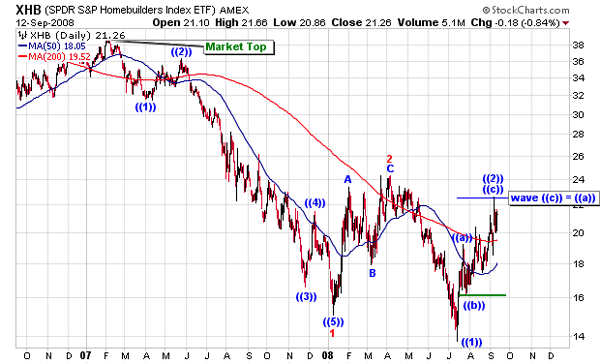
| The SPDR S&P Homebuilders Index ETF ( XHB) formed a major bull market top in February 2007. Since then, XHB has been trading downward, completing a five-wave move in early January 2008. These five downward waves determines the trend of one larger degree, which is also down. What this means is that these first five waves, from the market top in February 2007 to January 2008, form a larger wave 1 of the next larger five waves that will also unfold in the downward direction. Wave 2 of this larger degree of trend was also complete in early April. With the completion of the larger waves 1 and 2, the larger wave 3, which is also unfolding in the downward direction, has been under way since early April. Wave 3 is now unfolding in five smaller waves and are labeled ((1)), ((2)), ((3)), ((4)), and ((5)). The double parentheses indicate that ((1)) is called circle wave 1 and so forth. The chart shows that circle wave ((1)) was complete in mid-July and that circle wave ((2)) now looks complete as well. One way to determine if circle wave ((2)) is complete is to measure its length from the low of circle wave ((b)) and if it is equal to the length of circle wave ((a)), then that is a signal that it could be complete. I have shown where circle wave ((c)) is equal to circle wave ((a)) as a short horizontal blue line of the chart labeled "wave ((c)) = ((a))." This method gives the typical length in price movement to complete circle wave 2 but is not a hard and fast rule. Circle wave 2 can end before price rises to this level or may even end at a higher price level, but typically, wave c is equal in price length to wave a. For a more accurate determination of the completion of circle wave 2, it is necessary to look at the smaller time frames. |

|
| FIGURE 1: XHB, DAILY. This bar chart shows the major bull market top and the Elliott wave count. This chart shows that XHB has unfolded in five waves down from the market top. These five waves define the direction of the major trend as being in the downward direction. |
| Graphic provided by: StockCharts.com. |
| |
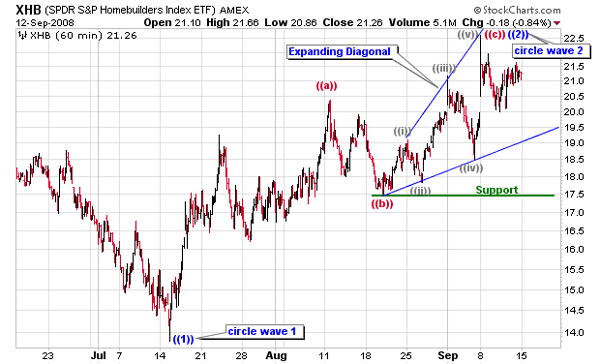
| Figure 2 is that of the 60-minute chart of XHB. This chart shows the wave structure of corrective circle wave ((2)). As can be seen from this chart, corrective circle wave 2 has unfolded in an ABC wave structure. Zigzag wave structures are a very typical pattern for second waves and unfold in three waves. The first wave is wave a and unfolds against the major trend. Since wave a has unfolded in the upward direction, it tells us that the major trend is in the downward direction. Wave b then unfolds in the direction of the major trend and wave c unfolds against the major trend, just as wave a does. Note that circle wave ((c)) has unfolded as an expanding diagonal wave pattern. Expanding diagonal wave patterns unfold in five waves, as shown on the chart. Note that all five waves look to be complete, and thus completing the expanding diagonal wave pattern. Expanding diagonal wave patterns are terminal wave patterns, and when they develop, they signal that the upward corrective move is over. So we have a complete ABC zigzag corrective pattern and an expanding diagonal wave pattern, both signaling the end of the market correction. As a confirmation signal I have shown a horizontal green support line drawn off the low of circle wave ((b)). If XHB moves below the low of circle wave ((b)), it will signal that the downward trend has resumed. Another way of determining if the move up from the mid-July low is over is by looking for a five-wave move of a small degree of trend in the downward direction after the completion of circle wave ((c)). Markets move in five waves in the direction of the major trend and in three waves in market corrections. To look at the small degree of trend, it is necessary to zoom in once again on a smaller time frame. |

|
| FIGURE 2: XHB, 60-MINUTE. This chart shows the market correction for XHB that started in mid-July. This chart also shows the Elliott wave count showing the market correction as unfolding as an abc market correction. |
| Graphic provided by: StockCharts.com. |
| |
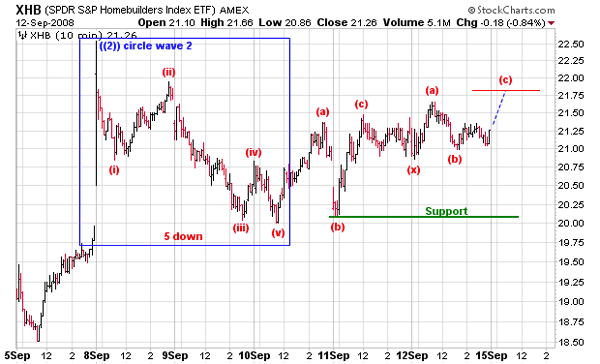
| In Figure 3, I have shown the 10-minute time frame. This chart shows the completion of circle wave ((2)) in early September and the five smaller nonoverlapping waves that follow. These waves are labeled wave (i), (ii), (iii), (iv), and (v). These five waves point in the direction of the major trend and are signaling that the corrective move off the mid-July low is now over and the downward direction of the major trend has resumed (I have highlighted this area in a blue box). Note also that upon completion of the fifth wave in the downward direction, XHB has entered into another market correction that is moving against the major trend. This corrective structure is unfolding as a double abc zigzag corrective wave pattern with the final wave (c) yet to unfold. I have drawn a red horizontal line at the price point where wave (c) should be complete. Again, this line is drawn off the (b) wave low and is the same length as wave (a). Once wave (c) is complete, the market will once again turn down and start to unfold in another five waves in the direction of the major trend, which is down. To confirm that wave (c) is over, I have again drawn a green horizontal support line off the low of wave (b). A move below this support line will confirm that the upward market correction is over and the downward trend has resumed. Please note that market corrections can always extend into more complex wave structures, although these are not high-probability situations. Typically, when a double zigzag is complete the corrective move is over, but we must be aware of this possibility. |

|
| FIGURE 3: XHB, 10-MINUTE. This chart shows the Elliott wave count. The five waves in the downward direction, in the blue box, show that the market correction off the July low has ended and the downward selloff has resumed. |
| Graphic provided by: StockCharts.com. |
| |
| In conclusion, XHB made a major market top in February 2007 and has unfolded in five waves to the downside. Five waves unfold in the direction of the major trend and, as such, is signaling that the major trend for the SPDR S&P Homebuilders Index ETF is in the downward direction. XHB has made a short-term bottom in mid-July and has been in a short-term market correction. Upon examination of two smaller time frames, we have identified that this short-term market correction is now over and the downward trend has resumed. |
Alan Northam lives in the Dallas, Texas area and as an electronic engineer gave him an analytical mind from which he has developed a thorough knowledge of stock market technical analysis. His abilities to analyze the future direction of the stock market has allowed him to successfully trade of his own portfolio over the last 30 years. Mr. Northam is now retired and trading the stock market full time. You can reach him at inquiry@tradersclassroom.com or by visiting his website at http://www.tradersclassroom.com. You can also follow him on Twitter @TradersClassrm.
| Garland, Tx | |
| Website: | www.tradersclassroom.com |
| E-mail address: | inquiry@tradersclassroom.com |
Click here for more information about our publications!
Comments
Date: 09/15/08Rank: 5Comment:

Request Information From Our Sponsors
- StockCharts.com, Inc.
- Candle Patterns
- Candlestick Charting Explained
- Intermarket Technical Analysis
- John Murphy on Chart Analysis
- John Murphy's Chart Pattern Recognition
- John Murphy's Market Message
- MurphyExplainsMarketAnalysis-Intermarket Analysis
- MurphyExplainsMarketAnalysis-Visual Analysis
- StockCharts.com
- Technical Analysis of the Financial Markets
- The Visual Investor
- VectorVest, Inc.
- Executive Premier Workshop
- One-Day Options Course
- OptionsPro
- Retirement Income Workshop
- Sure-Fire Trading Systems (VectorVest, Inc.)
- Trading as a Business Workshop
- VectorVest 7 EOD
- VectorVest 7 RealTime/IntraDay
- VectorVest AutoTester
- VectorVest Educational Services
- VectorVest OnLine
- VectorVest Options Analyzer
- VectorVest ProGraphics v6.0
- VectorVest ProTrader 7
- VectorVest RealTime Derby Tool
- VectorVest Simulator
- VectorVest Variator
- VectorVest Watchdog
