

HOT TOPICS LIST
- MACD
- Fibonacci
- RSI
- Gann
- ADXR
- Stochastics
- Volume
- Triangles
- Futures
- Cycles
- Volatility
- ZIGZAG
- MESA
- Retracement
- Aroon
INDICATORS LIST
LIST OF TOPICS
PRINT THIS ARTICLE
by Arthur Hill
After forming a rising wedge over the last two months, the financials SPDR declined sharply and is dangerously close to a continuation breakdown.
Position: Hold
Arthur Hill
Arthur Hill is currently editor of TDTrader.com, a website specializing in trading strategies, sector/industry specific breadth stats and overall technical analysis. He passed the Society of Technical Analysts (STA London) diploma exam with distinction is a Certified Financial Technician (CFTe). Prior to TD Trader, he was the Chief Technical Analyst for Stockcharts.com and the main contributor to the ChartSchool.
PRINT THIS ARTICLE
ADXR
Moment Of Truth For XLF
09/12/08 09:00:14 AMby Arthur Hill
After forming a rising wedge over the last two months, the financials SPDR declined sharply and is dangerously close to a continuation breakdown.
Position: Hold
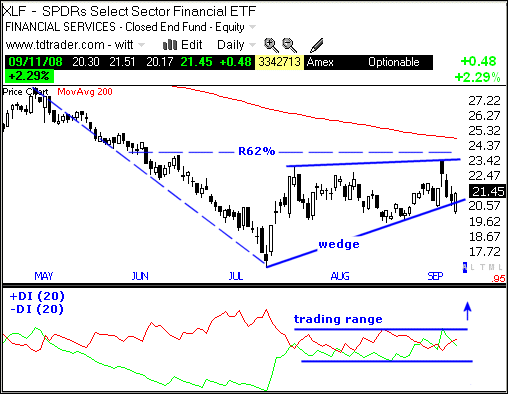
| Figure 1 focuses on the rising wedge. The financials SPDR (XLF) bottomed in July and retraced around 62% of its prior decline with a rising wedge advance over the last two months. XLF peaked this week and declined to the lower trendline over the last four days. A break looked imminent with a weak open on September 11, but XLF recovered by the close and the trendline is holding for now. |
|
| FIGURE 1: XLF, DAILY. This SPDR bottomed in July and retraced around 62% of its prior decline with a rising wedge advance over two months. |
| Graphic provided by: TeleChart2007. |
| |
| The bottom indicator shows the positive directional indicator (+DI) and the negative directional indicator (-DI). These are part of J. Welles Wilder's average directional movement index (ADX). As their names imply, +DI and -DI can be used to determine direction. A bullish bias exists when +DI is above -DI and a bearish bias when -DI is above +DI. Overall, these two have been trading flat the last few weeks and I am looking for an upside breakout for the next signal. A +DI breakout would be bullish, while a -DI breakout would be bearish. |
|
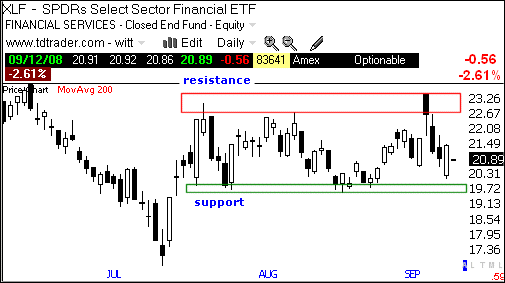
| FIGURE 2: XLF, DAILY. A trading range formed after the July surge. |
| Graphic provided by: TeleChart2007. |
| |
| Figure 2 focuses on a trading range that formed after the July surge. XLF has a support zone around 19.5 and a resistance zone around 23. With the ETF trading at support, a big test is at hand. A break below support would also reverse the rising wedge and point to lower prices. This would also likely to be accompanied with a -DI breakout. Such a combination would be bearish for XLF, and this ETF is at its moment of truth. To hold or not to hold, that is the challenge. |
Arthur Hill is currently editor of TDTrader.com, a website specializing in trading strategies, sector/industry specific breadth stats and overall technical analysis. He passed the Society of Technical Analysts (STA London) diploma exam with distinction is a Certified Financial Technician (CFTe). Prior to TD Trader, he was the Chief Technical Analyst for Stockcharts.com and the main contributor to the ChartSchool.
| Title: | Editor |
| Company: | TDTrader.com |
| Address: | Willem Geetsstraat 17 |
| Mechelen, B2800 | |
| Phone # for sales: | 3215345465 |
| Website: | www.tdtrader.com |
| E-mail address: | arthurh@tdtrader.com |
Traders' Resource Links | |
| TDTrader.com has not added any product or service information to TRADERS' RESOURCE. | |
Click here for more information about our publications!
Comments

Request Information From Our Sponsors
- StockCharts.com, Inc.
- Candle Patterns
- Candlestick Charting Explained
- Intermarket Technical Analysis
- John Murphy on Chart Analysis
- John Murphy's Chart Pattern Recognition
- John Murphy's Market Message
- MurphyExplainsMarketAnalysis-Intermarket Analysis
- MurphyExplainsMarketAnalysis-Visual Analysis
- StockCharts.com
- Technical Analysis of the Financial Markets
- The Visual Investor
- VectorVest, Inc.
- Executive Premier Workshop
- One-Day Options Course
- OptionsPro
- Retirement Income Workshop
- Sure-Fire Trading Systems (VectorVest, Inc.)
- Trading as a Business Workshop
- VectorVest 7 EOD
- VectorVest 7 RealTime/IntraDay
- VectorVest AutoTester
- VectorVest Educational Services
- VectorVest OnLine
- VectorVest Options Analyzer
- VectorVest ProGraphics v6.0
- VectorVest ProTrader 7
- VectorVest RealTime Derby Tool
- VectorVest Simulator
- VectorVest Variator
- VectorVest Watchdog