

HOT TOPICS LIST
- MACD
- Fibonacci
- RSI
- Gann
- ADXR
- Stochastics
- Volume
- Triangles
- Futures
- Cycles
- Volatility
- ZIGZAG
- MESA
- Retracement
- Aroon
INDICATORS LIST
LIST OF TOPICS
PRINT THIS ARTICLE
by Chaitali Mohile
The computer hardware index has formed symmetrical triangles on charts of two different time frames. The breakout may pull the index into a major downtrend.
Position: N/A
Chaitali Mohile
Active trader in the Indian stock markets since 2003 and a full-time writer. Trading is largely based upon technical analysis.
PRINT THIS ARTICLE
TRIANGLES
$HWI Entering A Major Downtrend
09/10/08 02:19:29 PMby Chaitali Mohile
The computer hardware index has formed symmetrical triangles on charts of two different time frames. The breakout may pull the index into a major downtrend.
Position: N/A
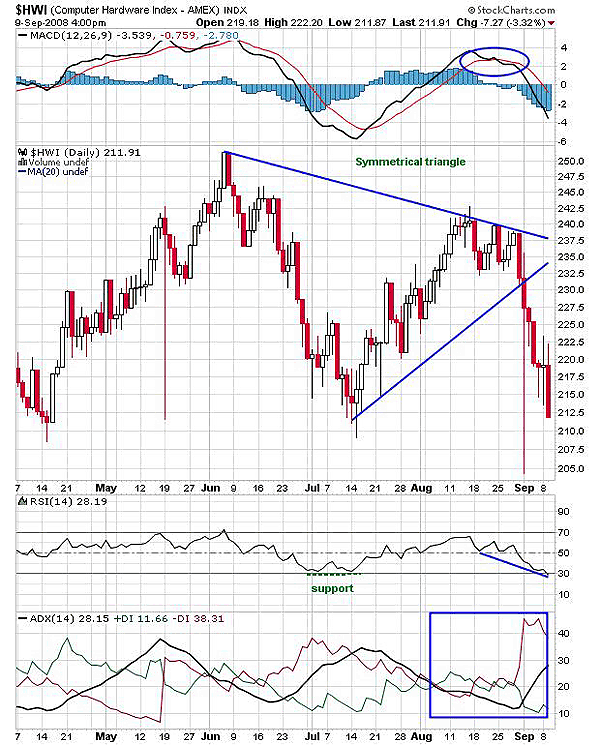
| In Figure 1, the Computer Hardware Index ($HWI) has formed a symmetrical triangle that broke down at the 232.50 level. The same pattern is under construction on the weekly time frame in Figure 2. When the same pattern appears on two different time frames, the pattern is considered to be most reliable, and the breakout leads to a significant rally. The breakout direction in the symmetrical triangle pattern is uncertain, so trading this pattern is difficult compared to other triangular formations like the ascending or descending triangles. Traders or investors can decide on the trading system only after the confirmed breakout of the symmetrical triangle. In Figure 1, the index broke down, strengthening the bearish hold. The breakout has moved near the lowest point of the triangle at 212 to 210. At these levels, the index is likely to establish support before heading toward the minimum estimated levels. |
| The potential target on the breakout of the symmetrical triangle can be calculated by measuring the height of the triangle. The height of triangle in Figure 1 is 250 - 210 = 40. Since the triangle has moved down, we subtract this distance from the breakout level at 232. Therefore, the minimum estimated level is 232 - 40 = 192. |
|
| FIGURE 1: $HWI, DAILY. The symmetrical triangle has moved below the lower trendline support. The support is likely to be established at the 212 - 210 level. |
| Graphic provided by: StockCharts.com. |
| |
| The moving average convergence/divergence (MACD) (12,26,9) has turned negative after the bearish breakout and marginally moved below the zero line. The relative strength index (RSI) (14) has declined to 30. The previous support of the indicator at 30 suggests that the RSI (14) has never slipped below the support level. So we can anticipate that the same support is established for the current rally as well. The average directional movement index (ADX) (14) is indicating a developing downtrend. At present, the MACD (12,26,9) and the RSI (14) are near their support levels, so the future direction of the rally is dependent on these support levels. |
|
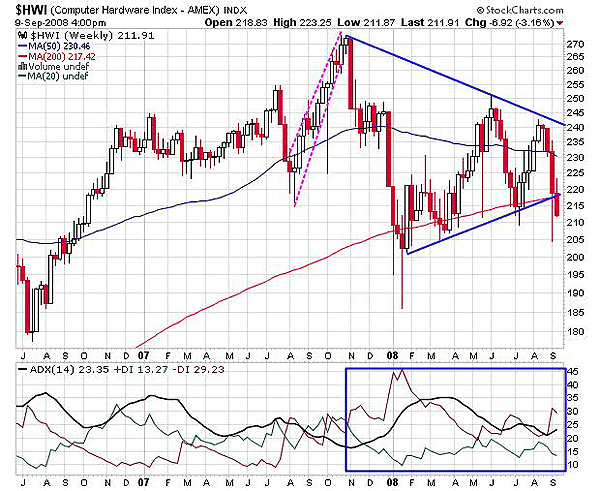
| FIGURE 2: $HWI, WEEKLY. The symmetrical triangle on this chart has not matured. The lower trendline and the 200-day MA are strong supports. |
| Graphic provided by: StockCharts.com. |
| |
| Figure 2 shows the steep upside rally from 215 to 270, forming a rising wedge. The rising wedge is a bearish pattern, and the pattern in Figure 2 gave a bearish breakout. After the breakout, the index corrected 25 points (270 - 245) in a week. Later, $HWI consolidated with the support of the 50-day moving average (MA) for nearly two months, forming a bearish flag & pennant continuation pattern. The breakout from this pattern was havoc as the index turned very bearish, but the 200-day moving average (MA) supported the index. The higher bottoms and lower tops have been forming a symmetrical triangle since early 2008. In this pattern, the converging upper and lower trendlines meet at one point. As a result, the trading range narrowed. The symmetrical triangle in Figure 2 has not matured, so the index is likely to move in a narrow range, provided the support/resistance of the lower and upper trendlines is respected. Along with the lower trendline, $HWI has the support of the 200-day MA. |
| The ADX (14) in Figure 2 indicates $HWI was in a downtrend since November 2007. This shows an intermediate downtrend for the past 10 to 11 months. But if the 200-day MA support is violated, the index may enter a major downtrend. Hence, it is healthier for $HWI to sustain above the 200-day MA and the lower trendline support levels. Below these support levels, 192 would be the target on a daily basis. |
Active trader in the Indian stock markets since 2003 and a full-time writer. Trading is largely based upon technical analysis.
| Company: | Independent |
| Address: | C1/3 Parth Indraprasth Towers. Vastrapur |
| Ahmedabad, Guj 380015 | |
| E-mail address: | chaitalimohile@yahoo.co.in |
Traders' Resource Links | |
| Independent has not added any product or service information to TRADERS' RESOURCE. | |
Click here for more information about our publications!
Comments

Request Information From Our Sponsors
- VectorVest, Inc.
- Executive Premier Workshop
- One-Day Options Course
- OptionsPro
- Retirement Income Workshop
- Sure-Fire Trading Systems (VectorVest, Inc.)
- Trading as a Business Workshop
- VectorVest 7 EOD
- VectorVest 7 RealTime/IntraDay
- VectorVest AutoTester
- VectorVest Educational Services
- VectorVest OnLine
- VectorVest Options Analyzer
- VectorVest ProGraphics v6.0
- VectorVest ProTrader 7
- VectorVest RealTime Derby Tool
- VectorVest Simulator
- VectorVest Variator
- VectorVest Watchdog
- StockCharts.com, Inc.
- Candle Patterns
- Candlestick Charting Explained
- Intermarket Technical Analysis
- John Murphy on Chart Analysis
- John Murphy's Chart Pattern Recognition
- John Murphy's Market Message
- MurphyExplainsMarketAnalysis-Intermarket Analysis
- MurphyExplainsMarketAnalysis-Visual Analysis
- StockCharts.com
- Technical Analysis of the Financial Markets
- The Visual Investor