HOT TOPICS LIST
- MACD
- Fibonacci
- RSI
- Gann
- ADXR
- Stochastics
- Volume
- Triangles
- Futures
- Cycles
- Volatility
- ZIGZAG
- MESA
- Retracement
- Aroon
INDICATORS LIST
LIST OF TOPICS
PRINT THIS ARTICLE
by Alan R. Northam
The US government bailed out ailing Freddie Mac and Fannie Mae. Some traders see this as a positive for the markets. However, the bailout changes nothing. Here's why.
Position: N/A
Alan R. Northam
Alan Northam lives in the Dallas, Texas area and as an electronic engineer gave him an analytical mind from which he has developed a thorough knowledge of stock market technical analysis. His abilities to analyze the future direction of the stock market has allowed him to successfully trade of his own portfolio over the last 30 years. Mr. Northam is now retired and trading the stock market full time. You can reach him at inquiry@tradersclassroom.com or by visiting his website at http://www.tradersclassroom.com. You can also follow him on Twitter @TradersClassrm.
PRINT THIS ARTICLE
ELLIOTT WAVE
Government Bailout Changes Nothing
09/10/08 01:43:51 PMby Alan R. Northam
The US government bailed out ailing Freddie Mac and Fannie Mae. Some traders see this as a positive for the markets. However, the bailout changes nothing. Here's why.
Position: N/A
| Over this past weekend, the US government seized control of mortgage giants Fannie Mae and Freddie Mac, which were on the verge of collapse due to the financial crisis that resulted in more than $500 billion in credit losses. Walter Hellwig, who helps oversee $30 billion at Morgan Asset Management in Birmingham, AL, said, "This is significantly positive for the market." On Monday, September 8, the Dow Jones Industrial Average (DJIA) surged 340 points on the news, as investors had been looking for some kind of resolution for the financial problem, and the bailout by the government eliminated a lot of uncertainty. But does this bailout by the government really change anything with respect to the future of the stock market? I think not. |
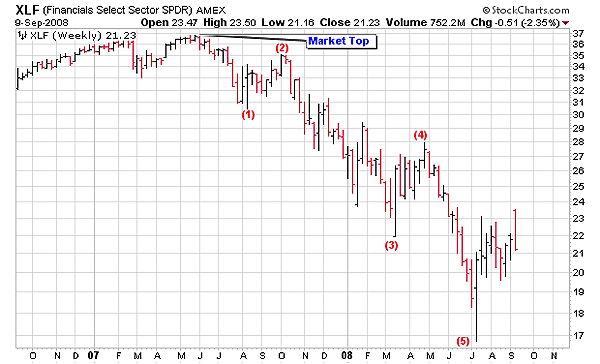
| Figure 1 shows the weekly bar chart of the Financial Select SPDR (XLF). The chart shows that XLF made a major bull market top in May 2007 and traded in downward through June 2008 and traced out a pattern of five nonoverlapping waves. According to Elliott wave theory, these five waves form an impulse wave that defines the next larger degree of trend as in a downward direction. What this means is that the downward trend is not yet over. As a minimum, according to Elliott wave theory, the downward trend should now trace out a corrective wave to correct the complete move down from May 2007 followed by at least one more round of five waves down similar to the five waves from the 2007 market top. |

|
| FIGURE 1: XLF, WEEKLY. This weekly bar chart shows the Elliott wave count. This chart shows that this market has completed five waves down and has entered into a market correction. |
| Graphic provided by: StockCharts.com. |
| |
| Looking at the last 10 weeks, the SPDR has been in the process of correcting for the move down from May 2007. Corrective waves following an impulse wave (five nonoverlapping waves) normally unfold in an ABC zigzag affair. This zigzag looks to be complete, but we must zoom in on a shorter time frame to make this determination. Before we do that, however, I want to point out the last bar on the chart. This last bar represents the first two days of trading activity for the week following the government bailout. Note that this week opened with the market gapping up on the news that the government had bailed out Freddie Mac and Fannie Mae. But also note that on Tuesday the market sold back off and closed below the closing price for the previous week. This market action does not show any conviction on the part of buyers to jump in and bid this market higher. It shows just the opposite; it shows that sellers were willing to step up and dump the shares that they were holding. This represents market weakness and is a signal that the market correction that started in July could be over. |
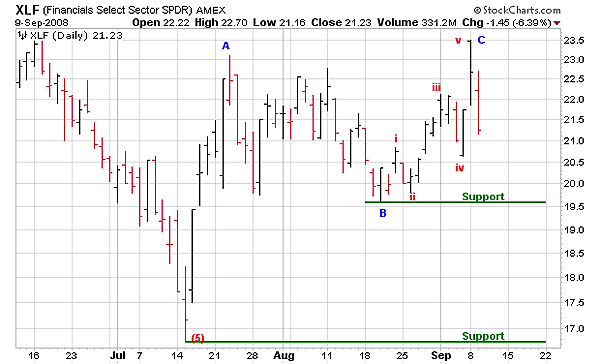
| Figure 2 shows the daily bar chart over the last three months. The daily chart shows that XLF entered into a market correction starting in mid-July and went on to complete corrective wave A later that month. Upon completion of wave A, XLF traded downward to complete wave B of the ABC zigzag correction in August. Finally, mid-August to today, XLF has been tracing out wave C, the final wave of the ABC zigzag correction. According to Elliott wave, wave C unfolds as five subwaves. As we can see from Figure 2, wave C has unfolded in five waves, with wave v now complete, which now completes the final wave C of the zigzag correction. We know that wave C is now complete because the last bar made a lower high and a lower low. If wave C was still unfolding, then the last bar would have had to make a higher high. To confirm that wave C is complete, I have drawn a support line off the low of wave B. A close below this support line will confirm that wave C is complete. |

|
| FIGURE 2: XLF, DAILY. This chart shows the detail of the market correction that started in mid-July. This chart illustrates that the market correction is now complete and XLF is now ready to start the next downward move that should unfold in five waves. |
| Graphic provided by: StockCharts.com. |
| |
| Although market corrections normally unfold in a simple ABC zigzag fashion following an impulse wave, there does exist the possibility that the market correction could morph into a more complex corrective structure. To help confirm that the market correction that started in July is over, I have shown a second support line drawn off the low price of wave (5). A break of this support line will then confirm that the market correction is over and that the next five-wave impulse to the downside is underway. In conclusion, the bailout of Freddie Mac and Fannie Mae has done nothing to change the direction of the financial market. If anything, all the bailout did was to shorten the time frame of wave C of the ABC zigzag market correction by a few days. From the chart, we have seen that XLF entered into a market correction almost two months before the bailout and that the final wave C of the ABC corrective move started two weeks prior to the bailout. To confirm that the market correction is over, a close below the support line drawn off the price low of wave B is needed. According to Elliott wave, the downward trend for XLF should have, at a minimum, one more five-wave move downward before a major trend reversal in the financial sector can be considered. To confirm that the next five waves are under way, I have drawn another support line off the price minimum of wave (5). A move below this support line will confirm that the next five-wave move down has begun. Upon completion of the next five waves down, the wave structure will need to be evaluated to determine if the financial market is ready to reverse its trend or if there is further downside movement to go. |
Alan Northam lives in the Dallas, Texas area and as an electronic engineer gave him an analytical mind from which he has developed a thorough knowledge of stock market technical analysis. His abilities to analyze the future direction of the stock market has allowed him to successfully trade of his own portfolio over the last 30 years. Mr. Northam is now retired and trading the stock market full time. You can reach him at inquiry@tradersclassroom.com or by visiting his website at http://www.tradersclassroom.com. You can also follow him on Twitter @TradersClassrm.
| Garland, Tx | |
| Website: | www.tradersclassroom.com |
| E-mail address: | inquiry@tradersclassroom.com |
Click here for more information about our publications!
PRINT THIS ARTICLE

Request Information From Our Sponsors
- StockCharts.com, Inc.
- Candle Patterns
- Candlestick Charting Explained
- Intermarket Technical Analysis
- John Murphy on Chart Analysis
- John Murphy's Chart Pattern Recognition
- John Murphy's Market Message
- MurphyExplainsMarketAnalysis-Intermarket Analysis
- MurphyExplainsMarketAnalysis-Visual Analysis
- StockCharts.com
- Technical Analysis of the Financial Markets
- The Visual Investor
- VectorVest, Inc.
- Executive Premier Workshop
- One-Day Options Course
- OptionsPro
- Retirement Income Workshop
- Sure-Fire Trading Systems (VectorVest, Inc.)
- Trading as a Business Workshop
- VectorVest 7 EOD
- VectorVest 7 RealTime/IntraDay
- VectorVest AutoTester
- VectorVest Educational Services
- VectorVest OnLine
- VectorVest Options Analyzer
- VectorVest ProGraphics v6.0
- VectorVest ProTrader 7
- VectorVest RealTime Derby Tool
- VectorVest Simulator
- VectorVest Variator
- VectorVest Watchdog
