HOT TOPICS LIST
- MACD
- Fibonacci
- RSI
- Gann
- ADXR
- Stochastics
- Volume
- Triangles
- Futures
- Cycles
- Volatility
- ZIGZAG
- MESA
- Retracement
- Aroon
INDICATORS LIST
LIST OF TOPICS
PRINT THIS ARTICLE
by Alan R. Northam
The bull market in XLE that started in 2002 came to an end in May 2008. XLE has broken the up trendline and is now in a market correction that could see XLE fall to 50 or more.
Position: N/A
Alan R. Northam
Alan Northam lives in the Dallas, Texas area and as an electronic engineer gave him an analytical mind from which he has developed a thorough knowledge of stock market technical analysis. His abilities to analyze the future direction of the stock market has allowed him to successfully trade of his own portfolio over the last 30 years. Mr. Northam is now retired and trading the stock market full time. You can reach him at inquiry@tradersclassroom.com or by visiting his website at http://www.tradersclassroom.com. You can also follow him on Twitter @TradersClassrm.
PRINT THIS ARTICLE
ELLIOTT WAVE
Energy Select SPDR Has Peaked
09/08/08 02:25:18 PMby Alan R. Northam
The bull market in XLE that started in 2002 came to an end in May 2008. XLE has broken the up trendline and is now in a market correction that could see XLE fall to 50 or more.
Position: N/A
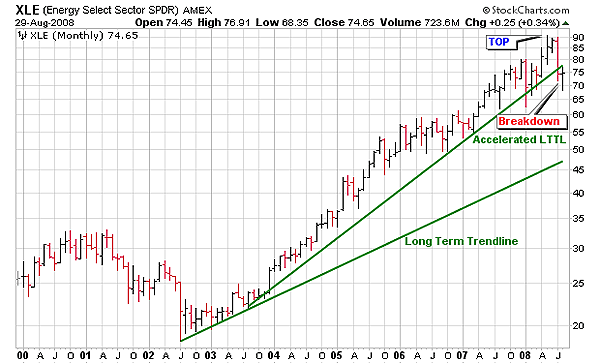
| Figure 1 is a monthly bar chart of the Energy Select Sector SPDR (XLE). This chart shows that over the last six years, the energy sector has been in a long-term bull market. Figure 1 shows a long-term trendline drawn off the monthly price lows from mid-2002 to mid-2003. Figure 1 also shows that the price of energy started to accelerate in mid-2003 and is illustrated by the more steep long-term trendline labeled "accelerated LTTL." This accelerated trend peaked in May 2008 and has been trading lower over the last three months. In July, energy broke down and closed below the accelerated trendline, ending this long-term upward trend. |

|
| FIGURE 1: XLE, MONTHLY. This price chart of XLE shows the long-term trendline and the accelerated long-term trendline. Note the breakdown in the accelerated long-term trendline July 2008. |
| Graphic provided by: SuperCharts. |
| |
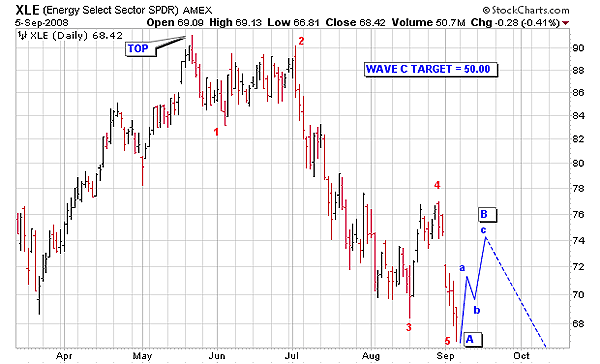
| Upon completion of an upward trend, a market will enter into a correction. These corrections normally occur as an ABC zigzag where wave A is a downward wave and is composed of five waves. Wave A is then followed by a B wave that unfolds in the upward direction and is normally a small abc zigzag. Once wave B is complete, wave C begins and unfolds in five waves and is often the length in time and price as wave A. XLE completed its upward trend in mid-May 2008 and has been in a market correction since. From mid-May to early September, XLE unfolded in the downward direction in five waves to complete wave A of an ABC zigzag correction. Looking at the monthly chart in Figure 1, the corrective waves are not visible, making it necessary to view the daily bar chart in Figure 2 to see the corrective waves. An astute observer will wonder how you know that wave 5 is now complete. To resolve this observation, it is necessary to go to a lower time frame such as the 10-minute chart. |

|
| FIGURE 2: XLE, DAILY. This chart shows the five Elliott waves that make up corrective wave A. Note the B wave forecast in blue made up of an abc zigzag and ending at the top of the open gap. Also note that the target price of zigzag wave C is calculated at 50. |
| Graphic provided by: StockCharts.com. |
| |
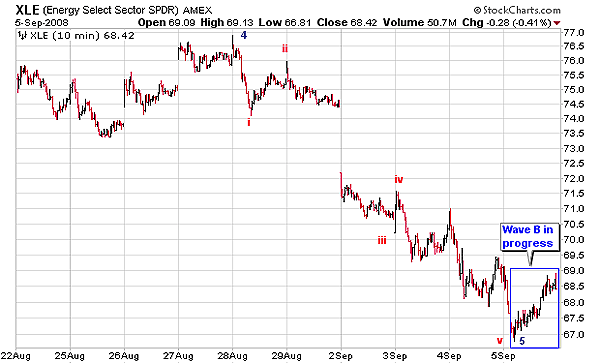
| The 10-minute chart in Figure 3 is shown. This chart shows the detail of wave 5. As can be seen wave 5 has unfolded in five smaller waves -- waves i, ii, iii, iv, and v. Figure 3 also shows that XLE has already started wave B. |

|
| FIGURE 3: XLE, 10-MINUTE. This 10-minute price chart of XLE shows the small Elliott waves that make up wave 5 of corrective wave A. Note that wave 5 is made up of five smaller waves showing that wave 5 down of wave A is complete. This chart also shows that corrective wave B has already started. |
| Graphic provided by: StockCharts.com. |
| |
| With corrective wave A complete, wave B has started to unfold. B waves normally unfold as small abc zigzags and should be complete somewhere near the high of wave 4. I have shown this small B wave ending at the top of the open gap in Figure 2. Markets tend to move up to close an open gap and then immediately turn back down so this is a logical place for wave B to end. Once wave B completes, XLE should then turn back down in five waves to complete wave C. I have shown a target price for the completion of wave C to be at 50. I arrived at this price target by taking the length of wave A and subtracting it. However, should XLE break down below the more shallow long-term trendline shown in Figure 1, then this market could fall to much lower prices. |
| In conclusion, the upward trend in the Select SPDR XLE that started in 2002 came to an end in May 2008 and has entered into a market correction. Market corrections normally unfold as a three-wave ABC zigzag affair with wave A of this zigzag now complete and wave B just getting under way. Upon completion of wave B, a final wave C in the downward direction will take XLE to a final low price that has been calculated to be at 50. There is, however, a possibility that XLE could fall to much lower prices. Once the market correction is over, a new bull market in energy will emerge. |
Alan Northam lives in the Dallas, Texas area and as an electronic engineer gave him an analytical mind from which he has developed a thorough knowledge of stock market technical analysis. His abilities to analyze the future direction of the stock market has allowed him to successfully trade of his own portfolio over the last 30 years. Mr. Northam is now retired and trading the stock market full time. You can reach him at inquiry@tradersclassroom.com or by visiting his website at http://www.tradersclassroom.com. You can also follow him on Twitter @TradersClassrm.
| Garland, Tx | |
| Website: | www.tradersclassroom.com |
| E-mail address: | inquiry@tradersclassroom.com |
Click here for more information about our publications!
PRINT THIS ARTICLE

|

Request Information From Our Sponsors
- StockCharts.com, Inc.
- Candle Patterns
- Candlestick Charting Explained
- Intermarket Technical Analysis
- John Murphy on Chart Analysis
- John Murphy's Chart Pattern Recognition
- John Murphy's Market Message
- MurphyExplainsMarketAnalysis-Intermarket Analysis
- MurphyExplainsMarketAnalysis-Visual Analysis
- StockCharts.com
- Technical Analysis of the Financial Markets
- The Visual Investor
- VectorVest, Inc.
- Executive Premier Workshop
- One-Day Options Course
- OptionsPro
- Retirement Income Workshop
- Sure-Fire Trading Systems (VectorVest, Inc.)
- Trading as a Business Workshop
- VectorVest 7 EOD
- VectorVest 7 RealTime/IntraDay
- VectorVest AutoTester
- VectorVest Educational Services
- VectorVest OnLine
- VectorVest Options Analyzer
- VectorVest ProGraphics v6.0
- VectorVest ProTrader 7
- VectorVest RealTime Derby Tool
- VectorVest Simulator
- VectorVest Variator
- VectorVest Watchdog
