HOT TOPICS LIST
- MACD
- Fibonacci
- RSI
- Gann
- ADXR
- Stochastics
- Volume
- Triangles
- Futures
- Cycles
- Volatility
- ZIGZAG
- MESA
- Retracement
- Aroon
INDICATORS LIST
LIST OF TOPICS
PRINT THIS ARTICLE
by Chaitali Mohile
A gap up in Cisco created a strong support line for the bullish rally. Any move below the support level could result in a big drop.
Position: N/A
Chaitali Mohile
Active trader in the Indian stock markets since 2003 and a full-time writer. Trading is largely based upon technical analysis.
PRINT THIS ARTICLE
SUPPORT & RESISTANCE
Is Cisco Losing Support?
09/05/08 11:33:49 AMby Chaitali Mohile
A gap up in Cisco created a strong support line for the bullish rally. Any move below the support level could result in a big drop.
Position: N/A
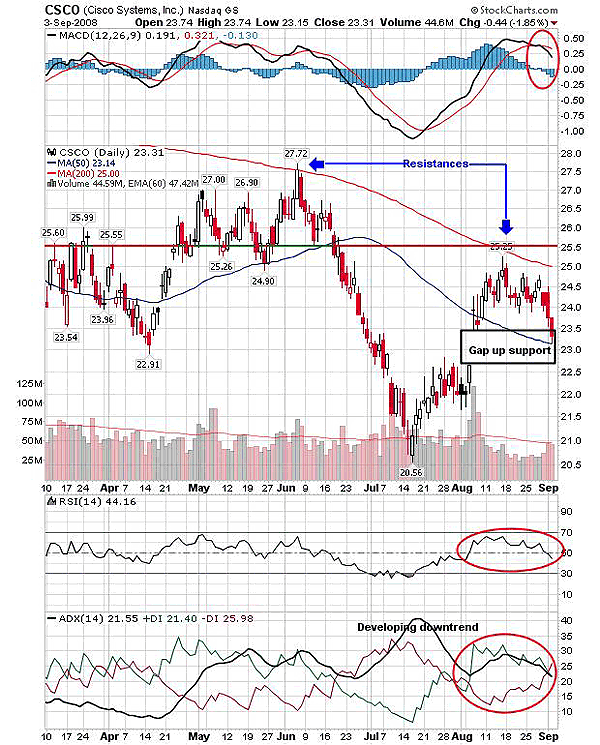
| Under the resistance of a 200-day moving average (MA), Cisco (CSCO) took a nosedive from $27.72 to $20.56. This sharp correction created a trend reversal, changing the uptrend to down. The relative strength index (RSI) (14) that moved in bullish levels also plunged to oversold levels. The average directional movement index (ADX) (14) in Figure 1 reached an overheated downtrend above 40. This indicated that the falling wedge formed on the price chart is ready to crack in an upward direction. In addition, the moving average convergence/divergence (MACD) (12,26,9) had a bullish crossover. So the rally that began from 20.56 in July 2008 had a strong bullish support. After the smooth drive up from 20.56 to 22.50, the stock jumped to 23.50. |
| The gap up of $1 in CSCO converted the first resistance of 50-day MA to support with encouraging volume. The stock rallied further to 25.25, pulling all three indicators to bullish areas. The 25.25 levels was the strong resistance zone, as two resistance levels intercepted each other. The first resistance was the declining 200-day MA, and the second was the previous support area for May-June 2008 consolidation. This support area is marked using the support-resistance tool (Figure 1). When this support-resistance line is extended, it intercepts with the 200-day MA. |

|
| FIGURE 1: CSCO, DAILY. Extending this support-resistance level intercepted the 200-day MA twice. |
| Graphic provided by: StockCharts.com. |
| |
| The volume declined as the stock approached these resistance zones. The gap up has created a healthy support zone for this breakout to consolidate within the two moving averages. If this support is breached, then CSCO may retrace to the previous lower levels. The 50-day MA support should also be watched. Currently, the stock stands close to this support zone, but the indicators are not positive toward the existing support. The RSI (14) has left the golden support of 50 levels, the ADX (14) indicates a developing downtrend, and the MACD (12,26,9) shows a bearish crossover. So CSCO is likely to convert the support zone of 22.50-23.50 (gap up) to the resistance zone. The weekly chart shown in Figure 2 has one more life line for the stock and for traders too. |
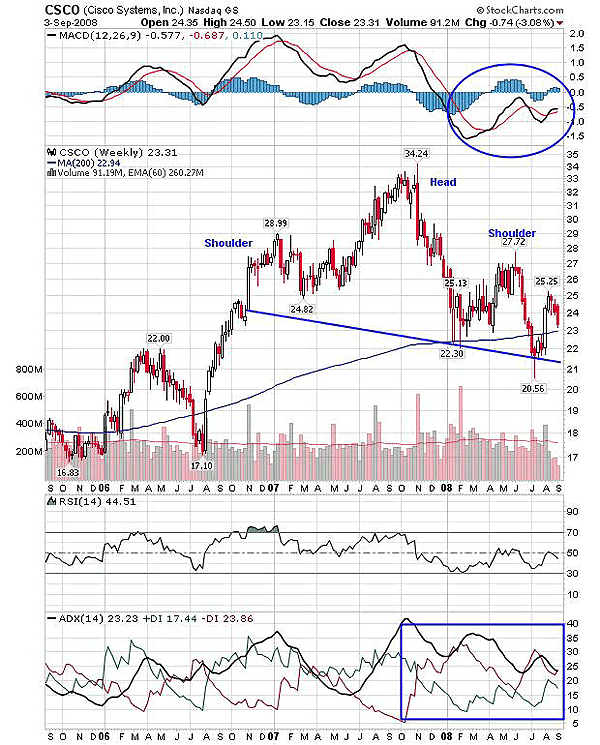
| On the weekly time frame, the head & shoulder top was being constructed since late 2006 with a declining neckline. The right shoulder was formed at 28.99, the head was completed in 2007 at 34.24, and the left shoulder at 27.72. The pattern was completed in July 2008 with the formation of the left shoulder. After the completion of the pattern, CSCO bounced from the neckline instead of breaking down from the neckline support. But the bounce failed to rally higher, and currently, CSCO is again headed toward the same support (neckline); see Figure 2. The lower end of the neckline shows 21 as the final support level. The breakdown of the head & shoulder top below the neckline would lead to the estimated level of 9.06. To calculate the target, you measure the distance between the highest peak (the head) and the neckline. Yo then subtract that distance from the neckline level. Therefore, 34.24 - 22.30 = 11.94 - 21 = 9.06 is the potential lower level. Here, the neckline levels subtracted are different as the line is declining. |

|
| FIGURE 2: CSCO, WEEKLY. The three-year weekly chart shows the head & shoulders top formation. The indicators are bearish, pulling down Cisco below the neckline support. |
| Graphic provided by: StockCharts.com. |
| |
| Traders can enter a short position below the neckline breakdown, as the indicators in Figure 2 are equally bearish. The RSI (14) is forming lower highs under the support-resistance of the 30-50 levels, respectively. CSCO has been in a downtrend since 2007, as indicated by the ADX (14). In addition, the MACD (12,26,9) is in negative territory. Following a stop-loss is essential to protect the profits. Initiating any short trade before the breakdown is tricky, as CSCO has already moved much lower from the highs. Cisco shows weakness on technical charts. Therefore, the possibility of sustaining above the support zone of a gap up on the daily chart, and the neckline support on the weekly chart, seems difficult. These bearish notes may drag CSCO to the targeted levels mentioned above. |
Active trader in the Indian stock markets since 2003 and a full-time writer. Trading is largely based upon technical analysis.
| Company: | Independent |
| Address: | C1/3 Parth Indraprasth Towers. Vastrapur |
| Ahmedabad, Guj 380015 | |
| E-mail address: | chaitalimohile@yahoo.co.in |
Traders' Resource Links | |
| Independent has not added any product or service information to TRADERS' RESOURCE. | |
Click here for more information about our publications!
Comments
Date: 09/07/08Rank: 2Comment:

Request Information From Our Sponsors
- StockCharts.com, Inc.
- Candle Patterns
- Candlestick Charting Explained
- Intermarket Technical Analysis
- John Murphy on Chart Analysis
- John Murphy's Chart Pattern Recognition
- John Murphy's Market Message
- MurphyExplainsMarketAnalysis-Intermarket Analysis
- MurphyExplainsMarketAnalysis-Visual Analysis
- StockCharts.com
- Technical Analysis of the Financial Markets
- The Visual Investor
- VectorVest, Inc.
- Executive Premier Workshop
- One-Day Options Course
- OptionsPro
- Retirement Income Workshop
- Sure-Fire Trading Systems (VectorVest, Inc.)
- Trading as a Business Workshop
- VectorVest 7 EOD
- VectorVest 7 RealTime/IntraDay
- VectorVest AutoTester
- VectorVest Educational Services
- VectorVest OnLine
- VectorVest Options Analyzer
- VectorVest ProGraphics v6.0
- VectorVest ProTrader 7
- VectorVest RealTime Derby Tool
- VectorVest Simulator
- VectorVest Variator
- VectorVest Watchdog
