HOT TOPICS LIST
- MACD
- Fibonacci
- RSI
- Gann
- ADXR
- Stochastics
- Volume
- Triangles
- Futures
- Cycles
- Volatility
- ZIGZAG
- MESA
- Retracement
- Aroon
INDICATORS LIST
LIST OF TOPICS
PRINT THIS ARTICLE
by David Penn
The ascending triangle in TSG is part consolidation, part top end of a two-month trend.
Position: N/A
David Penn
Technical Writer for Technical Analysis of STOCKS & COMMODITIES magazine, Working-Money.com, and Traders.com Advantage.
PRINT THIS ARTICLE
TRIANGLES
Triangles in Uptrends
06/08/01 01:57:41 PMby David Penn
The ascending triangle in TSG is part consolidation, part top end of a two-month trend.
Position: N/A
| Triangles often seem to play a dual role as both consolidation and continuation patterns. While this may seem contradictory on first glance, it becomes clearer when the goal (in this case, an upside breakout) is kept in mind. After all, upside breakouts can occur out of both consolidation patterns and continuations--in fact, one way of thinking about an accumulation area in an uptrend is by thinking of it as a hybrid consolidation/continuation zone. |
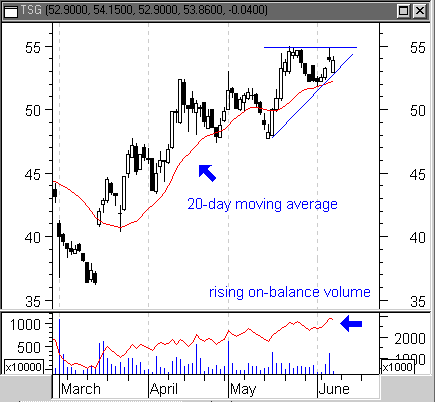
| Sabre Holdings Stk A (TSG) is the company that markets and distributes the SABER computer reservation system. And its ascending triangle, which began with a six-day advance in mid-May from 47.54 to 54.88 (a 15% move), comes both as the top end of a price climb of about 14% from mid-March to mid-May, as well as the higher end of a consolidation area that lasted for most of April (April prices oscillated between 48 and 52). |

|
| Figure 1: Rising on-balance volume suggests bullish days ahead for TSG. |
| Graphic provided by: MetaStock. |
| |
| The ascending triangle itself is considered to be a bullish chart pattern, generally speaking, insofar as continued testing and retesting of the horizontal resistance line is bullish when at the top of an uptrend. The price behavior reflects higher and higher prices being paid for the stock--albeit up to a point. Perhaps more importantly, the ascending triangle suggests that there is less and less of the stock available at the lower prices. The rising on-balance volume (OBV) indicator through the duration of the pattern suggests that buyers are increasingly interested in the stock, and are apparently willing to pay the higher prices. This is the kind of buying pressure that can lead to an upside breakout. |
| Another positive factor for further gains has to do with the stock's 20-day moving average. TSG has trended upwards, on balance, since the beginning of the year, with a relatively mild correction in late February/early March. Since the correction, TSG has used the 20-day moving average almost like a guardrail. Note how the bulls have consistently pushed the stock back over its 20-day moving average each time the bears tried to sell TSG off. While TSG has broken down before, the uptrend is intact, the buying volume on the increase, and an upward breakout more likely than a break on the downside. Given the size of the ascending triangle, TSG could see an upside breakout of 7 or more points. This comes from taking the difference from the highest high to the lowest low in the formation and adding that amount to the value at the top of the formation. A price objective of 62 would result. |
| There is enough support (again, much of April is consolidation) to keep TSG from moving downward for any sustained period of time. It is worthwhile to note, however, that TSG was on an uptrend at the beginning of the year when prices stumbled, recovered, and then plunged through their 20-day moving average in early March. Although this drop set the stage for the current TSG rally, the loss of about 16% (as measured from the downside breakdown beneath the 20-day moving average in February to the low in March), should be kept in mind should TSG break out on the downside in June. |
Technical Writer for Technical Analysis of STOCKS & COMMODITIES magazine, Working-Money.com, and Traders.com Advantage.
| Title: | Technical Writer |
| Company: | Technical Analysis, Inc. |
| Address: | 4757 California Avenue SW |
| Seattle, WA 98116 | |
| Phone # for sales: | 206 938 0570 |
| Fax: | 206 938 1307 |
| Website: | www.Traders.com |
| E-mail address: | DPenn@traders.com |
Traders' Resource Links | |
| Charting the Stock Market: The Wyckoff Method -- Books | |
| Working-Money.com -- Online Trading Services | |
| Traders.com Advantage -- Online Trading Services | |
| Technical Analysis of Stocks & Commodities -- Publications and Newsletters | |
| Working Money, at Working-Money.com -- Publications and Newsletters | |
| Traders.com Advantage -- Publications and Newsletters | |
| Professional Traders Starter Kit -- Software | |
Click here for more information about our publications!
Comments

|

Request Information From Our Sponsors
- StockCharts.com, Inc.
- Candle Patterns
- Candlestick Charting Explained
- Intermarket Technical Analysis
- John Murphy on Chart Analysis
- John Murphy's Chart Pattern Recognition
- John Murphy's Market Message
- MurphyExplainsMarketAnalysis-Intermarket Analysis
- MurphyExplainsMarketAnalysis-Visual Analysis
- StockCharts.com
- Technical Analysis of the Financial Markets
- The Visual Investor
- VectorVest, Inc.
- Executive Premier Workshop
- One-Day Options Course
- OptionsPro
- Retirement Income Workshop
- Sure-Fire Trading Systems (VectorVest, Inc.)
- Trading as a Business Workshop
- VectorVest 7 EOD
- VectorVest 7 RealTime/IntraDay
- VectorVest AutoTester
- VectorVest Educational Services
- VectorVest OnLine
- VectorVest Options Analyzer
- VectorVest ProGraphics v6.0
- VectorVest ProTrader 7
- VectorVest RealTime Derby Tool
- VectorVest Simulator
- VectorVest Variator
- VectorVest Watchdog
