HOT TOPICS LIST
- MACD
- Fibonacci
- RSI
- Gann
- ADXR
- Stochastics
- Volume
- Triangles
- Futures
- Cycles
- Volatility
- ZIGZAG
- MESA
- Retracement
- Aroon
INDICATORS LIST
LIST OF TOPICS
PRINT THIS ARTICLE
by Koos van der Merwe
How much farther can the Standard & Poor's 500 fall?
Position: Sell
Koos van der Merwe
Has been a technical analyst since 1969, and has worked as a futures and options trader with First Financial Futures in Johannesburg, South Africa.
PRINT THIS ARTICLE
GANN
Will The US Lead The Way To Recovery?
09/03/08 03:26:55 PMby Koos van der Merwe
How much farther can the Standard & Poor's 500 fall?
Position: Sell
| Over the years, I have written articles on the Kondratieff wave and the Standard & Poor's 500. The K-wave is calling for an end to the present financial setback in the world by 2012. So will the US again lead the way and recover ahead of the K-wave forecast? |

|
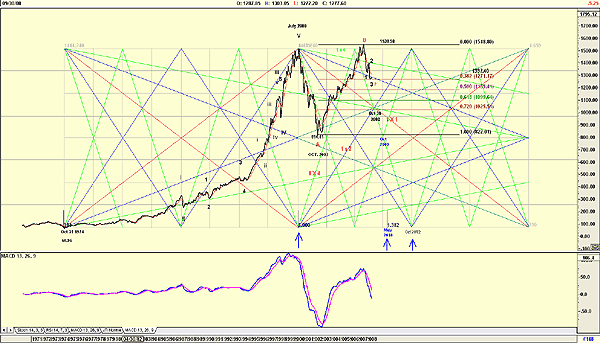
| FIGURE 1: SPX, MONTHLY. Note the Gann lines. |
| Graphic provided by: AdvancedGET. |
| |
| Figure 1 is a monthly chart of the S&P 500, with Gann chart lines superimposed. The chart shows the following: a. The index fell and tested 1271.17, the 38.2% Fibonacci level before correcting upward. Should it break below this level, and it can, then its next support level is the 50% level at 1185.41. b. The target date for testing this level is October 2008. c. Should the 50% level be broken, the next support level is 1099.64, the 61.8% level. d. The target date for testing this level is October 2009. e. The chart shows a Gann date of October 2012, which coincides with the K-wave prediction. f. The moving average convergence/divergence (MACD) is still very negative. However, wave theory does say that a bear market is usually 38.2% the length of the bull market, which means that the bear market for the S&P 500 could end in May 2010. Whether this will be at the 1099.64 level or lower, below the 822.01 level — below the support level of wave A — is the question. However, a little-known rule of Elliott wave says: - If wave 3 is less than wave 1, then wave 5 will be less than wave 3. - The length of wave 1 of wave C is 273.58 (1530.58 - 1257) - If the low of 1271.17 is the low of wave 3 of wave C, a drop of 134.71 (1405.88 - 1271.17), then wave 5 of wave C should be less than this — that is, not greater than 134.71. This means that the target of 1184.41 could well be the wave 5 of wave C target. Unfortunately, the time factor does not agree with this count, so we can expect wave 3 of wave C to be either at the 61.8% level of 1099.64, the 72% level of 1025.51 (a level more conducive to a wave 2) or even lower. One thing for sure is that wave 2 of wave C is a simple wave, and therefore we can expect wave 4 of wave C to be a complicated wave — which takes up time. Forecasting the actual turning point for the bottom of the S&P 500 is very much in the air at the moment, and depends on the turning point of wave 3 of wave C currently in progress. The time for that turning point, however, could well be May 2010, which means that should the K-wave date be correct, then the US will lead the world in recovery. |
Has been a technical analyst since 1969, and has worked as a futures and options trader with First Financial Futures in Johannesburg, South Africa.
| Address: | 3256 West 24th Ave |
| Vancouver, BC | |
| Phone # for sales: | 6042634214 |
| E-mail address: | petroosp@gmail.com |
Click here for more information about our publications!
PRINT THIS ARTICLE

Request Information From Our Sponsors
- StockCharts.com, Inc.
- Candle Patterns
- Candlestick Charting Explained
- Intermarket Technical Analysis
- John Murphy on Chart Analysis
- John Murphy's Chart Pattern Recognition
- John Murphy's Market Message
- MurphyExplainsMarketAnalysis-Intermarket Analysis
- MurphyExplainsMarketAnalysis-Visual Analysis
- StockCharts.com
- Technical Analysis of the Financial Markets
- The Visual Investor
- VectorVest, Inc.
- Executive Premier Workshop
- One-Day Options Course
- OptionsPro
- Retirement Income Workshop
- Sure-Fire Trading Systems (VectorVest, Inc.)
- Trading as a Business Workshop
- VectorVest 7 EOD
- VectorVest 7 RealTime/IntraDay
- VectorVest AutoTester
- VectorVest Educational Services
- VectorVest OnLine
- VectorVest Options Analyzer
- VectorVest ProGraphics v6.0
- VectorVest ProTrader 7
- VectorVest RealTime Derby Tool
- VectorVest Simulator
- VectorVest Variator
- VectorVest Watchdog
