HOT TOPICS LIST
- MACD
- Fibonacci
- RSI
- Gann
- ADXR
- Stochastics
- Volume
- Triangles
- Futures
- Cycles
- Volatility
- ZIGZAG
- MESA
- Retracement
- Aroon
INDICATORS LIST
LIST OF TOPICS
PRINT THIS ARTICLE
by Chaitali Mohile
A small range-bound rally may complete the cup with handle pattern. The bullish breakout of the pattern may attract new traders.
Position: Buy
Chaitali Mohile
Active trader in the Indian stock markets since 2003 and a full-time writer. Trading is largely based upon technical analysis.
PRINT THIS ARTICLE
CUP WITH HANDLE
Pfizer May See A Bullish Rally
09/04/08 08:30:30 AMby Chaitali Mohile
A small range-bound rally may complete the cup with handle pattern. The bullish breakout of the pattern may attract new traders.
Position: Buy
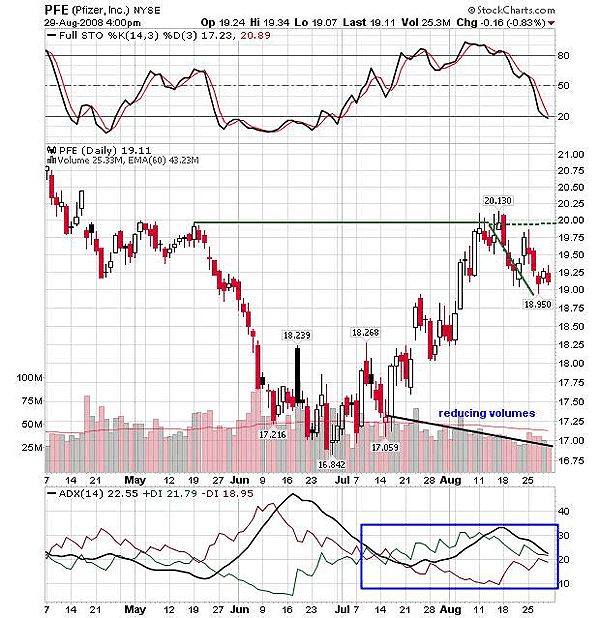
| Pfizer (PFE) entered a sideways consolidation in the 19.25 to 20 range after declining from the 21 levels. The sideways consolidation broke to the downside and continued the declining move. So the upper-side 20 level was highly important to maintain the bullish sentiments among the traders. But PFE failed to sustain above 20. As a result, the stock plunged to 17 and continued to form a lower low. The stock formed a very strong bottom by consolidating after every new low, and gradually, the descending rally changed direction. According to Figure 1, at 16.84, PFE formed a bottom and began to surge. During the bottom formation, the volume increased marginally. But as PFE began to move higher from the bottom, the volume failed to move with equal pace. |
| The low volume during the recovery restricted PFE to rally above the previous high at 20. As a result, the stock entered a small consolidation range. The entire movement of the past few months shows the formation of a cup with handle, with the breakout point at 20 (Figure 1). A cup with handle is a long-term bullish continuation pattern with potential uptrend. The duration of the cup is between seven and 65 weeks, and the handle forms in one or two weeks. In Figure 1, the cup has been constructed with a strong bottom, but the handle is yet to be completed. During the formation of the cup, the trend changed from down to an uptrend with a heavy buying pressure. The handle is formed by a small declining move within the 19-20 range. The pattern will be complete, with the price movement from 19.25 to 20. |

|
| FIGURE 1: PFE, DAILY. The cup with handle pattern is about to complete. |
| Graphic provided by: StockCharts.com. |
| |
| The stochastic (14,3,3) has reached the oversold level at 20, indicating an upside move. Though the average direction movement index (ADX) (14) is declining, the existing level of the trend indicator shows a developing uptrend. The convergence of positive directional index (+DI) and the negative directional index (-DI) indicate that the bullish consolidation is likely to continue. Thus, both the indicators suggest completion of the handle followed by the bullish breakout. Currently, the volume is reducing, but the breakout with huge volume is essential for the strong rally ahead. The breakout would sustain only by encouraging volume support. The potential target in this pattern is calculated by measuring the depth of the cup, and adding the distance to the breakout levels. The depth of the cup in Figure 1 is 20.13 - 16.84 = 3.29; therefore, the target will be 20.13 + 3.29 = 23.42. |
| Usually, investors like to buy at the lowest available price. So, investors would buy at the bottom of cup with the previous high as the target. Later as the handle gets formed, they might move out of the trade. But such trades are very tricky, as the pattern might fail or may even break down. Buying after a breakout is always a low-risk trade. I would recommend buying PFE only after the breakout and not in anticipation of the breakout, as that would be risky. Traders should wait for the pattern to be completed, and later on watch for a confirmed breakout above the 20 level. |
Active trader in the Indian stock markets since 2003 and a full-time writer. Trading is largely based upon technical analysis.
| Company: | Independent |
| Address: | C1/3 Parth Indraprasth Towers. Vastrapur |
| Ahmedabad, Guj 380015 | |
| E-mail address: | chaitalimohile@yahoo.co.in |
Traders' Resource Links | |
| Independent has not added any product or service information to TRADERS' RESOURCE. | |
Click here for more information about our publications!
Comments
Date: 09/07/08Rank: 4Comment:

Request Information From Our Sponsors
- StockCharts.com, Inc.
- Candle Patterns
- Candlestick Charting Explained
- Intermarket Technical Analysis
- John Murphy on Chart Analysis
- John Murphy's Chart Pattern Recognition
- John Murphy's Market Message
- MurphyExplainsMarketAnalysis-Intermarket Analysis
- MurphyExplainsMarketAnalysis-Visual Analysis
- StockCharts.com
- Technical Analysis of the Financial Markets
- The Visual Investor
- VectorVest, Inc.
- Executive Premier Workshop
- One-Day Options Course
- OptionsPro
- Retirement Income Workshop
- Sure-Fire Trading Systems (VectorVest, Inc.)
- Trading as a Business Workshop
- VectorVest 7 EOD
- VectorVest 7 RealTime/IntraDay
- VectorVest AutoTester
- VectorVest Educational Services
- VectorVest OnLine
- VectorVest Options Analyzer
- VectorVest ProGraphics v6.0
- VectorVest ProTrader 7
- VectorVest RealTime Derby Tool
- VectorVest Simulator
- VectorVest Variator
- VectorVest Watchdog
