HOT TOPICS LIST
- MACD
- Fibonacci
- RSI
- Gann
- ADXR
- Stochastics
- Volume
- Triangles
- Futures
- Cycles
- Volatility
- ZIGZAG
- MESA
- Retracement
- Aroon
INDICATORS LIST
LIST OF TOPICS
PRINT THIS ARTICLE
by Alan R. Northam
Wal-Mart is up against overhead resistance, and recent trading has produced a rare triple divergence. Is WMT about to fall again?
Position: N/A
Alan R. Northam
Alan Northam lives in the Dallas, Texas area and as an electronic engineer gave him an analytical mind from which he has developed a thorough knowledge of stock market technical analysis. His abilities to analyze the future direction of the stock market has allowed him to successfully trade of his own portfolio over the last 30 years. Mr. Northam is now retired and trading the stock market full time. You can reach him at inquiry@tradersclassroom.com or by visiting his website at http://www.tradersclassroom.com. You can also follow him on Twitter @TradersClassrm.
PRINT THIS ARTICLE
SUPPORT & RESISTANCE
Is Wal-Mart Stock About To Fall Again?
08/27/08 08:52:01 AMby Alan R. Northam
Wal-Mart is up against overhead resistance, and recent trading has produced a rare triple divergence. Is WMT about to fall again?
Position: N/A
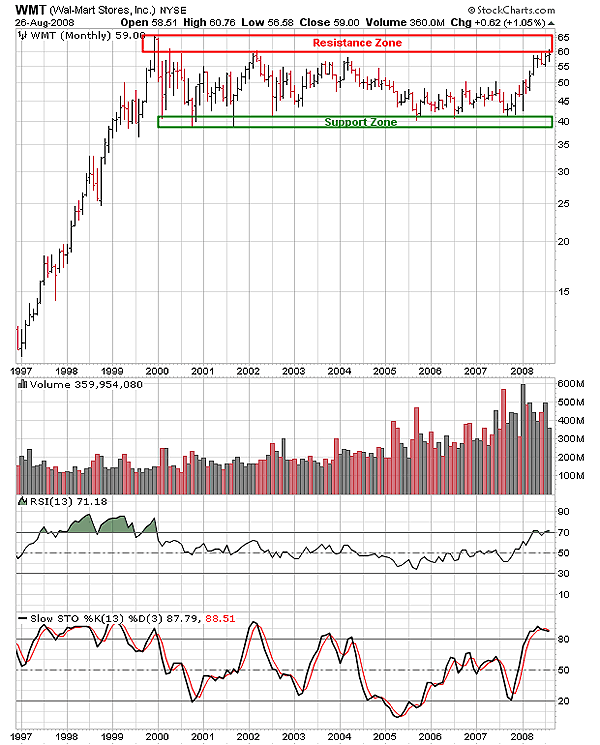
| Figure 1 shows the monthly bar chart of Wal-Mart Stores (WMT). This chart shows that Wal-Mart has been trading within a price range since the beginning of the millennium. If history repeats itself, then Wal-Mart is on the verge of its stock price falling again. Note that WMT started its last rally leg in mid-2007 and is now up against the overhead resistance zone. The question now is whether Wal-Mart has the force of the buyers behind its stock to move the price through this resistance zone and into new high territory. My answer is, "I don't think so!" and here's why: Volume is the force that moves markets higher, and volume has been dropping since the beginning of 2007. This month's volume has been the lowest. Therefore there is a very high probability that the price will not be able to push through the overhead resistance zone. The relative strength index (RSI) and the stochastics oscillator are also both above their respective 70% and 80% levels, indicating that Wal-Mart has been overbought, signaling that buyers may stop buying, as they may believe that Wal-Mart is now overpriced. This may lead to the sellers coming into the market, thus pushing the price of WMT back down. |

|
| FIGURE 1: WMT, MONTHLY. This chart shows that WMT has been trading in a range between the support zone and the resistance zone since 2000. This chart also show RSI above its 70% line for the first time since 2000, signaling that WMT is now overbought and could turn back down at any time. |
| Graphic provided by: StockCharts.com. |
| |
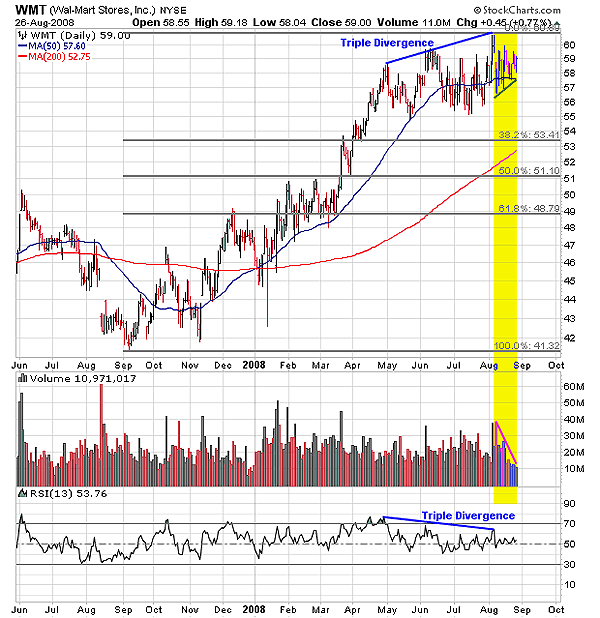
| Figure 2 is the daily price chart of WMT showing the latest rally off the mid-2007 price low. The daily price chart shows more detail of this latest advance. Note that from mid-2007 to May 2008, the price of WMT had no problems in advancing. However, from May until today, WMT has been struggling to advance. This is evident as the waves of each small rally and correction are severely overlapping. In addition, note the triple divergence between price and RSI. A divergence between price and an indicator such as RSI develops when the price moves one way and the indicator moves the other way. When price moves higher and the indicator moves lower, the divergence is known as a bearish divergence and signals underlying weakness. This weakness then increases the probability of the stock price turning back down. Triple divergences are rare and when they develop, traders are wise to stop and take notice. A triple divergence is a high-probability signal that the price is about to change directions. I have also highlighted the last area of trading in yellow. Note that as price continues to try to move higher, the volume is falling off drastically. This is an indication that the price may be right on the cusp of turning lower. |

|
| FIGURE 2: WMT, DAILY. This chart shows a rare triple divergence that is signaling that WMT could turn down at any time. This chart also shows that volume has been falling off quite rapidly of late, signaling that WMT could be on the brink of turning down. |
| Graphic provided by: StockCharts.com. |
| |
| In conclusion, WMT is now trading up against overhead resistance. Volume is falling, leaving the price without any strength behind it to keep moving it higher. A triple divergence has developed on the daily price chart, signaling that there is underlying weakness in this stock. Although there is always a chance that WMT could push through the overhead resistance zone and move into new high price territory, the odds are against it. Should WMT turn back down from the overhead resistance zone, then expect a minimum price correction to around $54 where the 200-day moving average and the Fibonacci 38.2% retracement areas intersect. However, should WMT continue to fall, then a complete retracement to the support area is possible, perhaps seeing the price of WMT at $40 before turning back up again. Overall, there is a very high probability that WMT prices are about to fall again. |
Alan Northam lives in the Dallas, Texas area and as an electronic engineer gave him an analytical mind from which he has developed a thorough knowledge of stock market technical analysis. His abilities to analyze the future direction of the stock market has allowed him to successfully trade of his own portfolio over the last 30 years. Mr. Northam is now retired and trading the stock market full time. You can reach him at inquiry@tradersclassroom.com or by visiting his website at http://www.tradersclassroom.com. You can also follow him on Twitter @TradersClassrm.
| Garland, Tx | |
| Website: | www.tradersclassroom.com |
| E-mail address: | inquiry@tradersclassroom.com |
Click here for more information about our publications!
Comments
Date: 08/27/08Rank: 4Comment:

Request Information From Our Sponsors
- StockCharts.com, Inc.
- Candle Patterns
- Candlestick Charting Explained
- Intermarket Technical Analysis
- John Murphy on Chart Analysis
- John Murphy's Chart Pattern Recognition
- John Murphy's Market Message
- MurphyExplainsMarketAnalysis-Intermarket Analysis
- MurphyExplainsMarketAnalysis-Visual Analysis
- StockCharts.com
- Technical Analysis of the Financial Markets
- The Visual Investor
- VectorVest, Inc.
- Executive Premier Workshop
- One-Day Options Course
- OptionsPro
- Retirement Income Workshop
- Sure-Fire Trading Systems (VectorVest, Inc.)
- Trading as a Business Workshop
- VectorVest 7 EOD
- VectorVest 7 RealTime/IntraDay
- VectorVest AutoTester
- VectorVest Educational Services
- VectorVest OnLine
- VectorVest Options Analyzer
- VectorVest ProGraphics v6.0
- VectorVest ProTrader 7
- VectorVest RealTime Derby Tool
- VectorVest Simulator
- VectorVest Variator
- VectorVest Watchdog
