HOT TOPICS LIST
- MACD
- Fibonacci
- RSI
- Gann
- ADXR
- Stochastics
- Volume
- Triangles
- Futures
- Cycles
- Volatility
- ZIGZAG
- MESA
- Retracement
- Aroon
INDICATORS LIST
LIST OF TOPICS
PRINT THIS ARTICLE
by Chaitali Mohile
The S&P 100 has retraced back to 38.2% retracement levels. The correction may hit the lowest level.
Position: N/A
Chaitali Mohile
Active trader in the Indian stock markets since 2003 and a full-time writer. Trading is largely based upon technical analysis.
PRINT THIS ARTICLE
REVERSAL
S&P 100 Has More Downside
08/27/08 08:37:31 AMby Chaitali Mohile
The S&P 100 has retraced back to 38.2% retracement levels. The correction may hit the lowest level.
Position: N/A
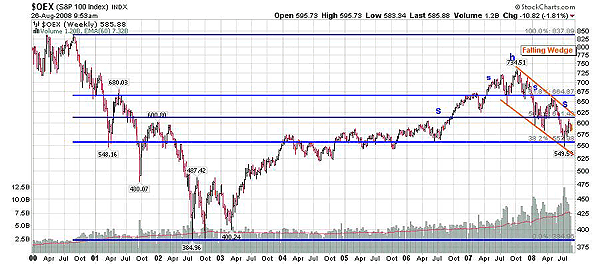
| The Standard & Poor's 100 ($OEX) witnessed a strong corrective phase in 2000–03. The correction that began in September 2000 from the 850 levels stopped in April 2003 at the 400 levels. With newly formed support at 400, the pullback rally gradually moved in the direction of the previous high. But the recovery process was much slower than the fall itself, as it took almost five years to cross back up the 61% retracement level. The Fibonacci retracement tool is used here in Figure 1 to measure the pullback levels. We can see that the index moved within the 38.2% and 53% retracement levels for the maximum period of recovery. Further, the index surged above the 61.8% level and soon reached the high at 734. With the support of the 61.8% retracment level in 2007, we can see a small head & shoulders top formation, with the head at 734 and the two shoulders at approximately at 720–715 levels (see Figure 1). As the neckline support was left behind, the oil price declined. |

|
| FIGURE 1: $OEX, WEEKLY. Here is the weekly bar chart with long-term data. The lower trendline of the falling wedge ends below the 38.2% retracement level. The chart shows a multiple head & shoulders formation. |
| Graphic provided by: StockCharts.com. |
| |
| During the correction from the 734 levels, the index formed a falling wedge, with the lower trendline moving below the 38.2% retracement support. The falling wedge is a bullish reversal pattern with the potential breakout in the upward direction. The volume during the formation is highly volatile. The falling wedge in Figure 1 has not matured yet and shows the possibility of a lower trendline getting tested for the fourth time at the level of 525, so the short-term downside can find support at the 525 level. |
| In Figure 1, the bar chart also shows that the index is forming another head & shoulders top, which is likely to be completed in the coming trading sessions. This formation has a larger time frame with two shoulders at 660–650 levels, and the previous small head & shoulder forms the head. Here, the neckline would be 575. This is the classic example of the multiple head & shoulders formation. Similar patterns are explained by Robert Edwards and John Magee in their classic work Technical Analysis Of Stock Trends. Let's refer to the same weekly chart with shorter data to understand the formation details and the prospective target levels. |

|
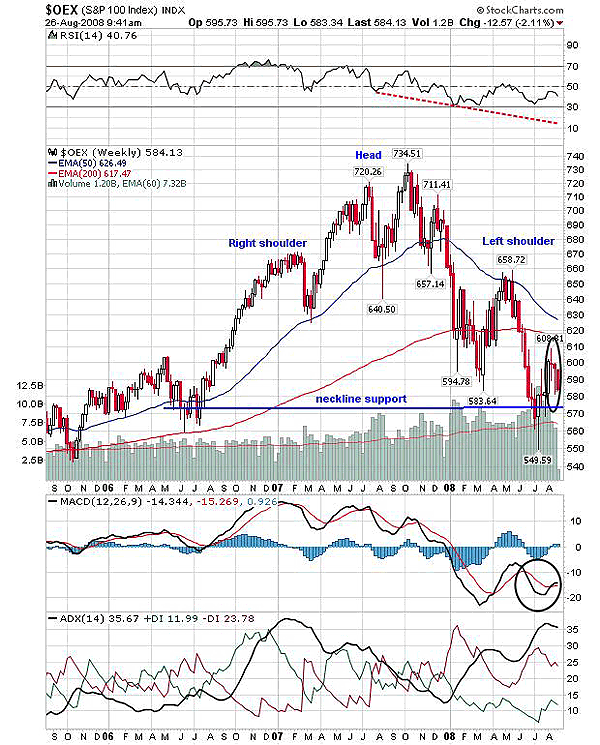
| FIGURE 2: $OEX, WEEKLY. The head & shoulders top reversal on this chart is a much larger formation and more reliable. The breakout of this formation would drag the index to the target of 416. |
| Graphic provided by: StockCharts.com. |
| |
| The head & shoulders top formation in Figure 2 is a bearish reversal pattern. With the breakout below the neckline, the index may enter a long-term downtrend. At the present, the index is in an intermediate downtrend, indicated by the average directional movement index (ADX) (14). And the breakout can make the downtrend stronger. The estimated downside target can be calculated by measuring the distance between the neckline support at 575 and the head at 734. The distance is 734 - 575 = 159, and by subtracting 159 from the neckline support of 575, we get the target of 416. Therefore, below the support at 525, the index may see the lowest level of 416 in the long term. |
| The relative strength index (RSI) (14) and the moving average convergence/divergence (MACD) (12,26,9) are highly bearish, supporting the present declining rally. The RSI (14) trendline joining the lower low shows the lowest possible support for the indicator at 10. Though the indicator ranges between 50 and 30, it is forming lower highs, indicating reducing bullish pressure. So all the three indicators together can drag $OEX to a lower trendline support of a falling wedge at 525. However, as the long-term head & shoulders top formation breaks down the neckline support at 575, the next downside target would be 416. Thus, $OEX is likely to see more downside below the 525 level. |
Active trader in the Indian stock markets since 2003 and a full-time writer. Trading is largely based upon technical analysis.
| Company: | Independent |
| Address: | C1/3 Parth Indraprasth Towers. Vastrapur |
| Ahmedabad, Guj 380015 | |
| E-mail address: | chaitalimohile@yahoo.co.in |
Traders' Resource Links | |
| Independent has not added any product or service information to TRADERS' RESOURCE. | |
Click here for more information about our publications!
Comments
Date: 08/27/08Rank: 3Comment:

Request Information From Our Sponsors
- VectorVest, Inc.
- Executive Premier Workshop
- One-Day Options Course
- OptionsPro
- Retirement Income Workshop
- Sure-Fire Trading Systems (VectorVest, Inc.)
- Trading as a Business Workshop
- VectorVest 7 EOD
- VectorVest 7 RealTime/IntraDay
- VectorVest AutoTester
- VectorVest Educational Services
- VectorVest OnLine
- VectorVest Options Analyzer
- VectorVest ProGraphics v6.0
- VectorVest ProTrader 7
- VectorVest RealTime Derby Tool
- VectorVest Simulator
- VectorVest Variator
- VectorVest Watchdog
- StockCharts.com, Inc.
- Candle Patterns
- Candlestick Charting Explained
- Intermarket Technical Analysis
- John Murphy on Chart Analysis
- John Murphy's Chart Pattern Recognition
- John Murphy's Market Message
- MurphyExplainsMarketAnalysis-Intermarket Analysis
- MurphyExplainsMarketAnalysis-Visual Analysis
- StockCharts.com
- Technical Analysis of the Financial Markets
- The Visual Investor
