

HOT TOPICS LIST
- MACD
- Fibonacci
- RSI
- Gann
- ADXR
- Stochastics
- Volume
- Triangles
- Futures
- Cycles
- Volatility
- ZIGZAG
- MESA
- Retracement
- Aroon
INDICATORS LIST
LIST OF TOPICS
PRINT THIS ARTICLE
by Arthur Hill
Caterpillar formed a triangle consolidation after a sharp decline. This pattern looks like it could be a rest before a continuation lower.
Position: Sell
Arthur Hill
Arthur Hill is currently editor of TDTrader.com, a website specializing in trading strategies, sector/industry specific breadth stats and overall technical analysis. He passed the Society of Technical Analysts (STA London) diploma exam with distinction is a Certified Financial Technician (CFTe). Prior to TD Trader, he was the Chief Technical Analyst for Stockcharts.com and the main contributor to the ChartSchool.
PRINT THIS ARTICLE
TRIANGLES
A Bearish Triangle For CAT
08/26/08 09:12:02 AMby Arthur Hill
Caterpillar formed a triangle consolidation after a sharp decline. This pattern looks like it could be a rest before a continuation lower.
Position: Sell
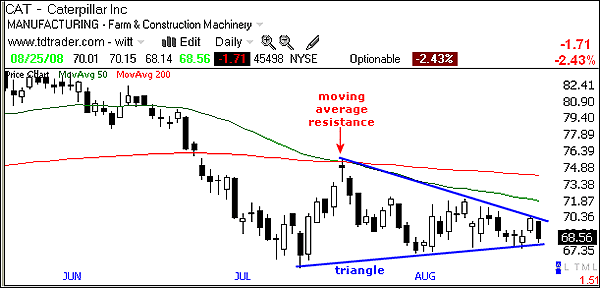
| Figure 1 focuses on the triangle and resistance. Caterpillar (CAT) declined sharply from late May to mid-July and broke both the 50-day and 200-day moving averages in the process. These moving averages converged to mark resistance for the July bounce (red arrow). Both moving averages are now moving lower and CAT is trading below both for a clear downtrend. |
|
| FIGURE 1: CAT, DAILY. This stock declined sharply from late May to mid-July and broke both the 50-day and 200-day moving averages in the process. |
| Graphic provided by: TeleChart2007. |
| |
| After the sharp decline, CAT consolidated from mid-July to late August and formed a triangle. Even though the triangle shows support from the July–August lows, the stock has not been above to bounce and remains in a clear downtrend. This downtrend favors a bearish resolution to the triangle. A break below triangle support (August lows) would signal a continuation of the prior decline and project a move to new lows. |
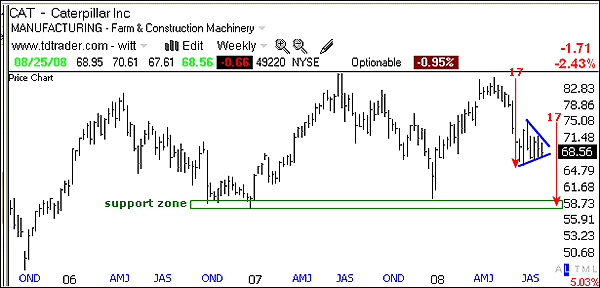
| The long-term perspective of the weekly chart allows for some downside target projections (Figure 2). First, the weekly chart shows a support zone around 57–59. This zone stems from the 2006 and 2007 lows. Can CAT make it to support for a third year running? A triangle break would target a move to this zone. |
|
| FIGURE 2: CAT, WEEKLY. Can CAT make it to support for the third year running? |
| Graphic provided by: TeleChart2007. |
| |
| For the second target, I am going to treat the triangle on the daily chart like a pennant or flag on the weekly chart. The first decline was 17 points (84 to 67). A similar move from the triangle high would project a decline to around 58 (75 - 17 = 58). This target jibes with the support zone target and further reinforces its validity. |
Arthur Hill is currently editor of TDTrader.com, a website specializing in trading strategies, sector/industry specific breadth stats and overall technical analysis. He passed the Society of Technical Analysts (STA London) diploma exam with distinction is a Certified Financial Technician (CFTe). Prior to TD Trader, he was the Chief Technical Analyst for Stockcharts.com and the main contributor to the ChartSchool.
| Title: | Editor |
| Company: | TDTrader.com |
| Address: | Willem Geetsstraat 17 |
| Mechelen, B2800 | |
| Phone # for sales: | 3215345465 |
| Website: | www.tdtrader.com |
| E-mail address: | arthurh@tdtrader.com |
Traders' Resource Links | |
| TDTrader.com has not added any product or service information to TRADERS' RESOURCE. | |
Click here for more information about our publications!
Comments
Date:�08/27/08Rank:�5Comment:�

Request Information From Our Sponsors
- StockCharts.com, Inc.
- Candle Patterns
- Candlestick Charting Explained
- Intermarket Technical Analysis
- John Murphy on Chart Analysis
- John Murphy's Chart Pattern Recognition
- John Murphy's Market Message
- MurphyExplainsMarketAnalysis-Intermarket Analysis
- MurphyExplainsMarketAnalysis-Visual Analysis
- StockCharts.com
- Technical Analysis of the Financial Markets
- The Visual Investor
- VectorVest, Inc.
- Executive Premier Workshop
- One-Day Options Course
- OptionsPro
- Retirement Income Workshop
- Sure-Fire Trading Systems (VectorVest, Inc.)
- Trading as a Business Workshop
- VectorVest 7 EOD
- VectorVest 7 RealTime/IntraDay
- VectorVest AutoTester
- VectorVest Educational Services
- VectorVest OnLine
- VectorVest Options Analyzer
- VectorVest ProGraphics v6.0
- VectorVest ProTrader 7
- VectorVest RealTime Derby Tool
- VectorVest Simulator
- VectorVest Variator
- VectorVest Watchdog