HOT TOPICS LIST
- MACD
- Fibonacci
- RSI
- Gann
- ADXR
- Stochastics
- Volume
- Triangles
- Futures
- Cycles
- Volatility
- ZIGZAG
- MESA
- Retracement
- Aroon
INDICATORS LIST
LIST OF TOPICS
PRINT THIS ARTICLE
by Chaitali Mohile
The sharp plunge in oil prices since July brought great relief across the financial markets. The commodity has cooled almost $40 from the highs. Can the oversold stochastic result in a price bounce?
Position: N/A
Chaitali Mohile
Active trader in the Indian stock markets since 2003 and a full-time writer. Trading is largely based upon technical analysis.
PRINT THIS ARTICLE
STOCHASTICS
Crude Oil May Bounce Back
08/26/08 11:29:08 AMby Chaitali Mohile
The sharp plunge in oil prices since July brought great relief across the financial markets. The commodity has cooled almost $40 from the highs. Can the oversold stochastic result in a price bounce?
Position: N/A
| In these charts, I have used the full stochastic since I find it more flexible. The additional parameter of the full stochastic is the smoothing factor of 14,3,3. |

|
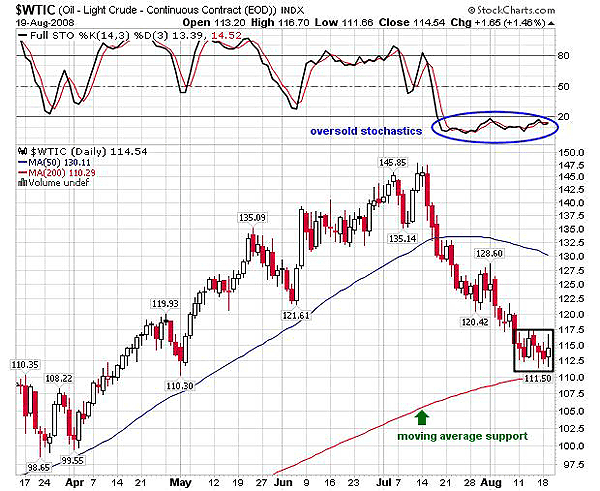
| FIGURE 1: $WTIC, DAILY. The oversold stochastic (14,3,3) and the 200-day MA support may help crude oil bounce back. |
| Graphic provided by: StockCharts.com. |
| |
| According to Figure 1, the oil light-crude ($WTIC) was at its peak at $147, and the stochastic (14,3,3) was overbought. The overbought indicator was unable to sustain above 80, resulting in a steep fall. Eventually, the price of oil began its downside trip from the lifetime high. As the price reached $132, the stochastic entered the oversold area below 20. Since then, the oscillator moved in the oversold zone, forming a higher low. However, $WTIC moved to a lower low and soon plunged to $117.50. Thus, the stochastic (14,3,3) showed positive divergence toward price movement. In Figure 1, we can see that the $WTIC is consolidating after the prolonged fall (see the marked square). Usually, the consolidation range after an advance/decline rally breaks in the direction of the existing rally. But in case of $WTIC, the breakdown possibility looks difficult due to two reasons, with first that the positive divergence and the stochastic has been in oversold territory for more than a month. The second reason is the strong 200-day moving average (MA) support at 111.50. Hence, the bullish breakout is possible under this scenario. |

|
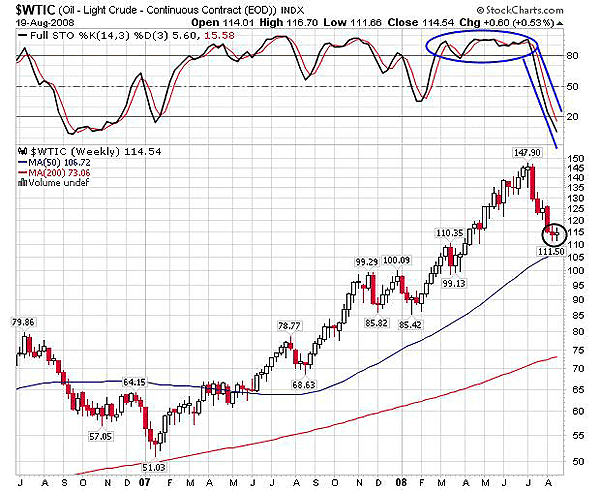
| FIGURE 2: $WTIC, WEEKLY. The stochastic remained highly overbought for more than three months and then had a nosedive to the oversold region. The small two candles marked in the circle reflect the losing bearish strength. |
| Graphic provided by: StockCharts.com. |
| |
| In Figure 2, the stochastic (14,3,3) remained highly overbought for more than three months. The entire breakout rally from $100 was carried by overbought stochastic. By the time crude oil reached $147, there was hardly any space left for the oscillator to move higher. As a result, the oil prices failed to move higher. The stochastic (14,3,3) had a nosedive from the overbought area and dragged $WTIC to lower support. The large red candles in Figure 2 shows that the fall in prices was stronger earlier. As the price moved nearer to the previous low at 110, the bearish force weakened, and the stochastic also slipped below 20 levels. This indicated limited downside for the correction, and hence the possibility of pullback rally arose. The downward rally was exhausted, and thus it moved sideways for two weeks in August 2008. Due to the highly oversold stochastic, the breakout of a sideways rangebound move is anticipated in an upward direction. |
| In the present volatile financial market, the stability of the breakout is more important. We cannot trade blindly just with an oversold oscillator, or in anticipation of a bullish breakout. The stochastic (14,3,3) has to move above 20 for a stable rally, and the price should eventually sustain above $122. |
| Considering both charts, the oil prices are likely to bounce. The breakout would be confirmed only above $120 to $122 levels. I would suggest that traders wait for this confirmation before initiating any position. |
Active trader in the Indian stock markets since 2003 and a full-time writer. Trading is largely based upon technical analysis.
| Company: | Independent |
| Address: | C1/3 Parth Indraprasth Towers. Vastrapur |
| Ahmedabad, Guj 380015 | |
| E-mail address: | chaitalimohile@yahoo.co.in |
Traders' Resource Links | |
| Independent has not added any product or service information to TRADERS' RESOURCE. | |
Click here for more information about our publications!
Comments
Date: 08/27/08Rank: 3Comment:

Request Information From Our Sponsors
- StockCharts.com, Inc.
- Candle Patterns
- Candlestick Charting Explained
- Intermarket Technical Analysis
- John Murphy on Chart Analysis
- John Murphy's Chart Pattern Recognition
- John Murphy's Market Message
- MurphyExplainsMarketAnalysis-Intermarket Analysis
- MurphyExplainsMarketAnalysis-Visual Analysis
- StockCharts.com
- Technical Analysis of the Financial Markets
- The Visual Investor
- VectorVest, Inc.
- Executive Premier Workshop
- One-Day Options Course
- OptionsPro
- Retirement Income Workshop
- Sure-Fire Trading Systems (VectorVest, Inc.)
- Trading as a Business Workshop
- VectorVest 7 EOD
- VectorVest 7 RealTime/IntraDay
- VectorVest AutoTester
- VectorVest Educational Services
- VectorVest OnLine
- VectorVest Options Analyzer
- VectorVest ProGraphics v6.0
- VectorVest ProTrader 7
- VectorVest RealTime Derby Tool
- VectorVest Simulator
- VectorVest Variator
- VectorVest Watchdog
