HOT TOPICS LIST
- MACD
- Fibonacci
- RSI
- Gann
- ADXR
- Stochastics
- Volume
- Triangles
- Futures
- Cycles
- Volatility
- ZIGZAG
- MESA
- Retracement
- Aroon
INDICATORS LIST
LIST OF TOPICS
PRINT THIS ARTICLE
by Koos van der Merwe
The Olympic Games have ended. Is the atmospheric pollution back?
Position: Buy
Koos van der Merwe
Has been a technical analyst since 1969, and has worked as a futures and options trader with First Financial Futures in Johannesburg, South Africa.
PRINT THIS ARTICLE
ELLIOTT WAVE
Post-Olympics, Will Prices Rise Again?
08/25/08 11:00:31 AMby Koos van der Merwe
The Olympic Games have ended. Is the atmospheric pollution back?
Position: Buy
| As China gets back to its normal smog and haze, as industry that was shut down to clear the air ahead of the Olympic Games start reopening, the price of oil, gold, copper, and other metals will start rising. True or false? |

|
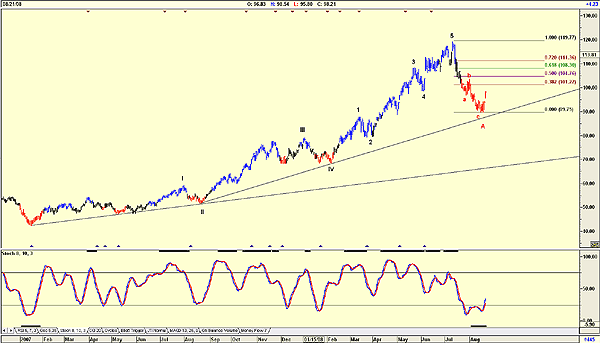
| FIGURE 1: US OIL FUND. Is a B-wave correction on the cards? |
| Graphic provided by: AdvancedGET. |
| |
| Figure 1 is that of the US Oil Fund. The chart is suggesting that a B-wave correction is on the cards, with a target of 101.22 (38.2%), 104.76 (50%), or 108.30 (61.8%). B-waves are however unpredictable, so we could easily see the price move to the 111.36 (72%) or even 119.77 (100%) level. The stochastic oscillator shown is confirming a rise in the price. |

|
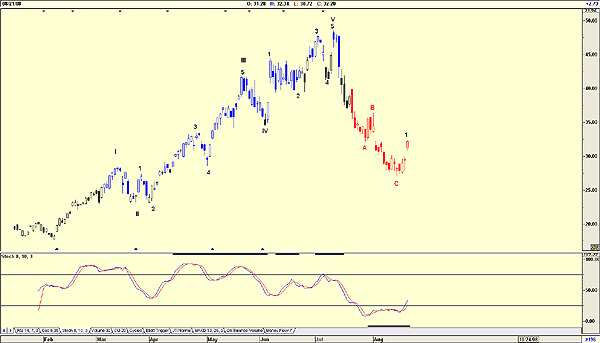
| FIGURE 2: HORIZON BETA PRO CRUDE OIL BULL. A movement up looks like it may be on its way. |
| Graphic provided by: AdvancedGET. |
| |
| Figure 2 is the Horizon Betapro Oil Bull ETF and is also suggesting that a movement up is on the cards. Do remember that this ETF is geared; the ETF moves at twice the rate of the oil price, hence its extreme correction to the wave 2 level. Once again, the stochastic oscillator is suggesting strength. |

|
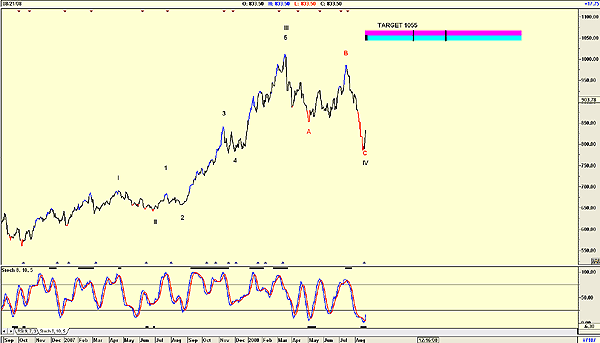
| FIGURE 3: LONDON GOLD, DAILY. A wave 5 with a target of 1055 may be on the way. |
| Graphic provided by: AdvancedGET. |
| |
| Figure 3 is a daily chart of the London gold price. The wave count of the chart suggests that we could see a wave 5 up with a target of 1055. The stochastic oscillator confirms that the immediate short-term trend for gold is up. |

|
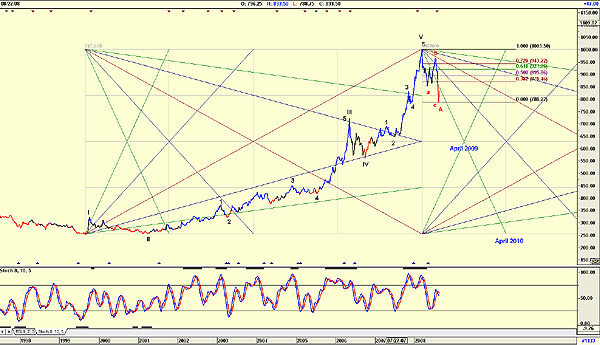
| FIGURE 4: LONDON GOLD, WEEKLY. An A-wave may be now complete, with a B-wave soon to follow. |
| Graphic provided by: AdvancedGET. |
| |
| Figure 4, on the other hand, suggests that an A-wave down is now complete, with a B-wave up to follow. Gann analysis suggests that the B-wave could top in April 2009, with the C-wave bottoming in April 2010. Fibonacci retracement levels for the B-wave top is 870.46 (38.2%), 895.86 (50%), and 921.26 (61.8%), with an outside 943.22 (72%) and 1003.50 (100%), should the B-wave rise higher than expectations The stochastic oscillator shown does suggest that a buy signal is still to come, so we could see gold dropping lower. This does, however, contradict the daily chart, leading me to believe that it is projecting a C-wave bottom as its buy signal. To conclude, it does look as if the rumor that commodities, especially oil and gold are in for an increase in price as the Olympics end in China, and Industry reestablishes itself. However, a look at charts on copper and other commodities need to be examined to confirm this theory. At any rate, we will soon find out as pollution once again pervades the atmosphere of China. |
Has been a technical analyst since 1969, and has worked as a futures and options trader with First Financial Futures in Johannesburg, South Africa.
| Address: | 3256 West 24th Ave |
| Vancouver, BC | |
| Phone # for sales: | 6042634214 |
| E-mail address: | petroosp@gmail.com |
Click here for more information about our publications!
Comments
Date: 08/25/08Rank: 2Comment:

Request Information From Our Sponsors
- StockCharts.com, Inc.
- Candle Patterns
- Candlestick Charting Explained
- Intermarket Technical Analysis
- John Murphy on Chart Analysis
- John Murphy's Chart Pattern Recognition
- John Murphy's Market Message
- MurphyExplainsMarketAnalysis-Intermarket Analysis
- MurphyExplainsMarketAnalysis-Visual Analysis
- StockCharts.com
- Technical Analysis of the Financial Markets
- The Visual Investor
- VectorVest, Inc.
- Executive Premier Workshop
- One-Day Options Course
- OptionsPro
- Retirement Income Workshop
- Sure-Fire Trading Systems (VectorVest, Inc.)
- Trading as a Business Workshop
- VectorVest 7 EOD
- VectorVest 7 RealTime/IntraDay
- VectorVest AutoTester
- VectorVest Educational Services
- VectorVest OnLine
- VectorVest Options Analyzer
- VectorVest ProGraphics v6.0
- VectorVest ProTrader 7
- VectorVest RealTime Derby Tool
- VectorVest Simulator
- VectorVest Variator
- VectorVest Watchdog
