HOT TOPICS LIST
- MACD
- Fibonacci
- RSI
- Gann
- ADXR
- Stochastics
- Volume
- Triangles
- Futures
- Cycles
- Volatility
- ZIGZAG
- MESA
- Retracement
- Aroon
INDICATORS LIST
LIST OF TOPICS
PRINT THIS ARTICLE
by Ron Walker
The relative strength index gave an early signal to the current weakness on the QQQQ by forming a top failure swing. Additional clues in other time frames suggest that there may be further downside to come.
Position: N/A
Ron Walker
Ron Walker is an active trader and technical analyst. He operates an educational website dedicated to the study of Technical Analysis. The website offers free market analysis with daily video presentations and written commentaries. Ron is a video pioneer, being one of the first to utilize the internet producing Technical Analysis videos. His website is thechartpatterntrader.com
PRINT THIS ARTICLE
WILDER'S RSI
The QQQQ Gets A Top Failure Swing
08/21/08 08:54:31 AMby Ron Walker
The relative strength index gave an early signal to the current weakness on the QQQQ by forming a top failure swing. Additional clues in other time frames suggest that there may be further downside to come.
Position: N/A
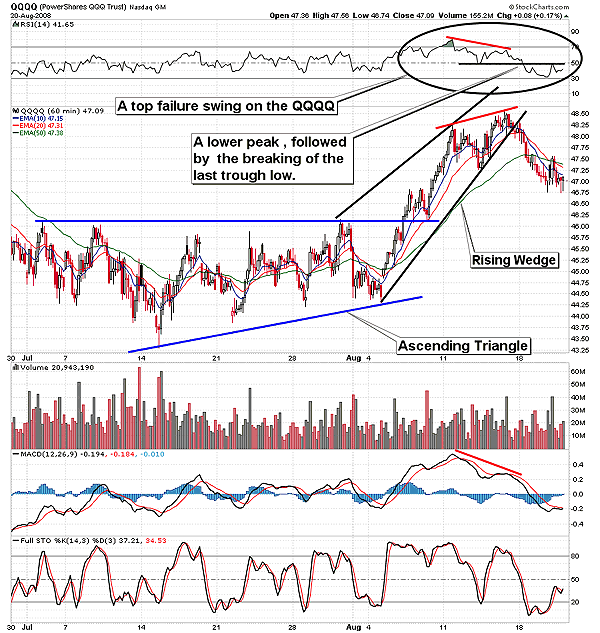
| The PowerShares QQQ Trust (QQQQ) recently formed some traditional chart patterns on its hourly chart that astute traders were able to spot in the 60-minute time frame. The QQQQ formed an ascending triangle as prices moved back and forth in a narrow trading range between the $43 to $46 range during July. In Figure 1, the QQQQ broke out of an ascending triangle on its 60-minute chart in early August. QQQQ rose sharply, but the advance stalled near $48.50. During the ascension, a bearish rising wedge emerged on the scene. On Friday, August 15, a divergence appeared between the RSI and the QQQQ on the 60-minute chart. Later, at the end of that trading session, the rising wedge broke down as prices penetrated through the rising trendline of the pattern. |

|
| FIGURE 1: QQQQ, 60-MINUTE. Here on the 60-minute chart, negative divergence has appeared on the RSI, forming a lower second RSI peak. Shortly after the divergence, the RSI line breaks below the middle trough, marking the top. |
| Graphic provided by: StockCharts.com. |
| |
| The following trading session on Monday, August 18, the RSI added further evidence that the short-term trend was changing in the 60-minute time frame. Previously on August 15, a lower high appeared on the RSI, and then on August 18, the RSI broke below the previous trough low, forming a top failure swing. J. Welles Wilder, who developed the RSI, introduced the concept of a failure swing in his 1978 book, New Concepts In Technical Trading Systems. When the RSI peaks above 70 and then proceeds to put in a lower peak on the RSI during the next rally, it is a sign of weakness. Usually, a divergence forms between the RSI and price. A top failure swing transpires when the RSI forms a second peak that cannot move above the first peak, which is followed by a downside break of the last trough low (Figure 1). The QQQQ did get a break of the last trough low, confirming a top failure swing. The same day that the failure swing occurred, the RSI tested the broken confirmation line just under the value of 50, but it was unsuccessful moving back above it. |
| The following day, on Tuesday, August 19, the RSI drifted lower as the QQQQ penetrated below the previous minor low at $47.25. That was followed by weak rally back up to test the 50-day exponential moving average (EMA) on its 60-minute chart. That caused the RSI to rise and test the broken confirmation line once again. It is noteworthy that the top failure swing on QQQQ was confirmed by other indicators. The direction movement indicators (DMI) got a bearish cross, the moving average convergence/divergence (MACD) had negative divergence as well, and then MACD proceeded to break below its signal line and move below zero. |

|
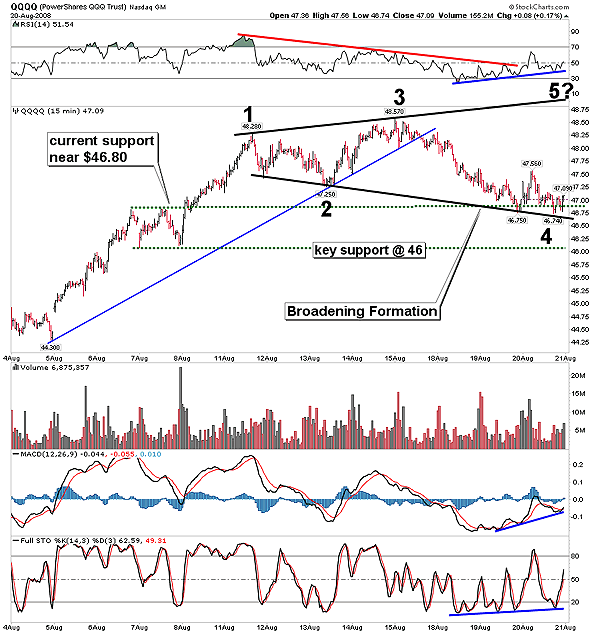
| FIGURE 2: QQQQ, 15-MINUTE. On the 15-minute chart, the QQQQ could be getting ready to rally back up and form the fifth-wave of a potential broadening top. Note how prices broke below the previous minor low of $47.25 and came to rest on the lower trendline of the pattern near the next level of support near $46.80. Positive divergence on the MACD suggests that the fifth-wave emerges. |
| Graphic provided by: StockCharts.com. |
| |
| In Figure 2, you can see on the QQQQ 15-minute chart that a price break occurred below the last minor low of $47.25, causing prices to move to the next level of support near the $46.80 level. Thus, a broadening formation appears to be under construction in the 15-minute time frame. Key support level is just below that near $46. The QQQQ may attempt to form another way in a recovery, given there is a divergence forming on the full stochastic (14, 3, 3). In addition to the broadening formation, the QQQQ has already broken down from a double-top pattern, with the confirmation line being $47.25. If prices rise boldly above the confirmation line, then greater weight should be placed on the broadening formation. At this time, the criteria of both patterns have been met but further breakdown will add credibility to a double-top pattern, while a short-term spike in prices give authenticity to the broadening formation. Looking at the short-term bullish conditions on the 15-minute chart, I think the odds favor the bounce to complete the fifth wave on the broadening formation. Broadening tops have a tendency to form a five-pointer before a reversal occurs with three minor highs and two minor lows. But a five-point reversal is not a mandatory requirement for a broadening formation, but it is a characteristic often associated with the pattern. If the top failure swing is to maintain its authority, then prices should put a lower high rather than moving to a new high and completing the fifth wave. This is known as a partial rise on a broadening formation, and it occurs when prices are too feeble to complete the fifth-wave formation. |

|
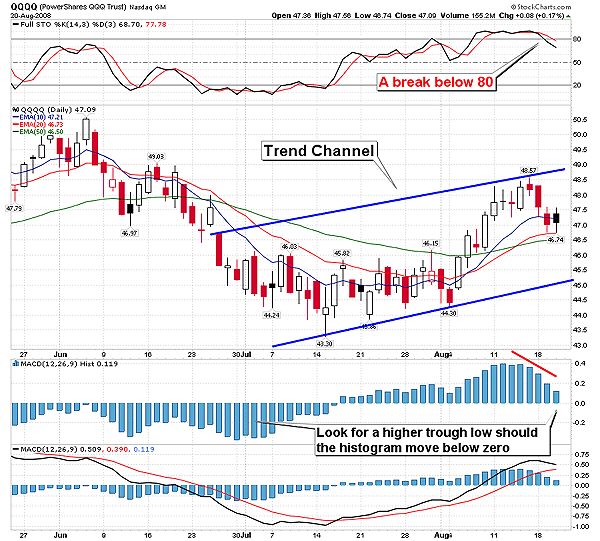
| FIGURE 3: QQQQ, DAILY. If prices rise back up to form a broadening top on the QQQQ 15-minute chart, the pattern could break down and test the rising trendline in the daily time frame near $45.50. That would form a new intermediate trend and allow the current rising price channel to remain intact. |
| Graphic provided by: StockCharts.com. |
| |
| In Figure 3, prices could move lower to test the rising trendline in the current price channel that originated from the July 15th low. That rising trendline is currently pointing toward $45.50, which could be hit should the $46 level of support be violated. Should $45.50 be tested and hold up, the QQQQs will have developed a new intermediate trend in its current rising price channel. In addition, the MACD histogram has a downward slope on the daily chart. If prices erode back to the rising trend, the MACD histogram should move below zero. If that takes place, watch for a higher trough to form on the histogram, and then for the histogram bars to start rising again in an upward slope. That would confirm support at the rising trendline. |
Ron Walker is an active trader and technical analyst. He operates an educational website dedicated to the study of Technical Analysis. The website offers free market analysis with daily video presentations and written commentaries. Ron is a video pioneer, being one of the first to utilize the internet producing Technical Analysis videos. His website is thechartpatterntrader.com
| Website: | thechartpatterntrader.com |
| E-mail address: | thechartpatterntrader@gmail.com |
Click here for more information about our publications!
Comments

|

Request Information From Our Sponsors
- StockCharts.com, Inc.
- Candle Patterns
- Candlestick Charting Explained
- Intermarket Technical Analysis
- John Murphy on Chart Analysis
- John Murphy's Chart Pattern Recognition
- John Murphy's Market Message
- MurphyExplainsMarketAnalysis-Intermarket Analysis
- MurphyExplainsMarketAnalysis-Visual Analysis
- StockCharts.com
- Technical Analysis of the Financial Markets
- The Visual Investor
- VectorVest, Inc.
- Executive Premier Workshop
- One-Day Options Course
- OptionsPro
- Retirement Income Workshop
- Sure-Fire Trading Systems (VectorVest, Inc.)
- Trading as a Business Workshop
- VectorVest 7 EOD
- VectorVest 7 RealTime/IntraDay
- VectorVest AutoTester
- VectorVest Educational Services
- VectorVest OnLine
- VectorVest Options Analyzer
- VectorVest ProGraphics v6.0
- VectorVest ProTrader 7
- VectorVest RealTime Derby Tool
- VectorVest Simulator
- VectorVest Variator
- VectorVest Watchdog
