

HOT TOPICS LIST
- MACD
- Fibonacci
- RSI
- Gann
- ADXR
- Stochastics
- Volume
- Triangles
- Futures
- Cycles
- Volatility
- ZIGZAG
- MESA
- Retracement
- Aroon
INDICATORS LIST
LIST OF TOPICS
PRINT THIS ARTICLE
by James Kupfer
Gold's speculative bubble has burst. Where are we headed from here?
Position: Sell
James Kupfer
Mr. Kupfer is a market professional and amateur stock market commentator. Disclosure: It is likely that Mr. Kupfer has or will enter a position in any security he writes about.
PRINT THIS ARTICLE
FIBONACCI
Gold's Fall From Grace
08/20/08 08:36:53 AMby James Kupfer
Gold's speculative bubble has burst. Where are we headed from here?
Position: Sell
| I hope this won't come as a surprise to you, but it should be clear even to gold bugs that the yellow metal has been in a speculative bubble that started in 2001. Whenever an asset class rises from $250 to more than $1,000 in just a few short years, that is the mark of a bubble, akin to the fabled tulip stocks long ago and the technology stocks in 2000. Well, the gold bubble has burst. |
| If you study the history of market bubbles across multiple asset classes, you may note that the majority of those assets retreat approximately 90% of their gain since the bubble's beginning. That would indicate an eventual retreat of gold to around $325. This, however, will likely take a few years to come to pass, if ever. |
| In the meantime, let's focus on potential price targets that could happen over the next few months. Looking at Figure 1, you will see that I have drawn the three primary Fibonacci retracement levels on the chart. I used the 2001 bottom to this year's peak price. |
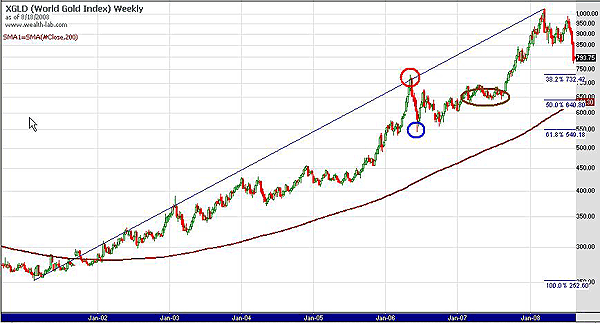
|
| FIGURE 1: GLD, WEEKLY. Note the three primary Fibonacci retracement levels. |
| Graphic provided by: Wealth-Lab. |
| |
| While Fibonacci levels are significant by themselves, you'll notice that each major level also corresponds closely to a significant technical resistance level. I have circled those resistance levels on the chart. The 2006 price peak, marked in red, now acts as support and is very close to the 38.2% retracement level. The 2006 price lows, circled in blue (but also earlier in the year), correspond to the 61.8% retracement level. Finally, the lower prices from the period of price congestion from 2007 (brown oval) match closely to the 50% retracement level. In the same vein, if you take 161.8% of the price movement between the March 2008 top and the May 2008 price low, you will find that it indicates a price target of almost $730. The 161.8% figure is a Fibonacci value that can be used to calculate price targets. And, of course, the $730 value is almost identical to the 38.2% retracement level mentioned earlier. |
| Given the bursting of this bubble, I think it is likely that gold will eventually move to at least the $550 level, but first it will have some very strong support along the way at $730 and $640. Look for these to be significant price levels that gold must hold to have any chance of eventually moving back up above the $1,000 level. |
Mr. Kupfer is a market professional and amateur stock market commentator. Disclosure: It is likely that Mr. Kupfer has or will enter a position in any security he writes about.
Click here for more information about our publications!
Comments
Date:�08/25/08Rank:�3Comment:�
Date:�08/26/08Rank:�3Comment:�
Date:�08/28/08Rank:�5Comment:�

Request Information From Our Sponsors
- StockCharts.com, Inc.
- Candle Patterns
- Candlestick Charting Explained
- Intermarket Technical Analysis
- John Murphy on Chart Analysis
- John Murphy's Chart Pattern Recognition
- John Murphy's Market Message
- MurphyExplainsMarketAnalysis-Intermarket Analysis
- MurphyExplainsMarketAnalysis-Visual Analysis
- StockCharts.com
- Technical Analysis of the Financial Markets
- The Visual Investor
- VectorVest, Inc.
- Executive Premier Workshop
- One-Day Options Course
- OptionsPro
- Retirement Income Workshop
- Sure-Fire Trading Systems (VectorVest, Inc.)
- Trading as a Business Workshop
- VectorVest 7 EOD
- VectorVest 7 RealTime/IntraDay
- VectorVest AutoTester
- VectorVest Educational Services
- VectorVest OnLine
- VectorVest Options Analyzer
- VectorVest ProGraphics v6.0
- VectorVest ProTrader 7
- VectorVest RealTime Derby Tool
- VectorVest Simulator
- VectorVest Variator
- VectorVest Watchdog