HOT TOPICS LIST
- MACD
- Fibonacci
- RSI
- Gann
- ADXR
- Stochastics
- Volume
- Triangles
- Futures
- Cycles
- Volatility
- ZIGZAG
- MESA
- Retracement
- Aroon
INDICATORS LIST
LIST OF TOPICS
PRINT THIS ARTICLE
by Ron Walker
The Russell 2000 (small cap stocks) has been on the road to recovery and is now testing the highs made in early June. It looks poised to clear June's overhead resistance in the near future, but might need a pullback to build the momentum to get the job done.
Position: N/A
Ron Walker
Ron Walker is an active trader and technical analyst. He operates an educational website dedicated to the study of Technical Analysis. The website offers free market analysis with daily video presentations and written commentaries. Ron is a video pioneer, being one of the first to utilize the internet producing Technical Analysis videos. His website is thechartpatterntrader.com
PRINT THIS ARTICLE
TECHNICAL ANALYSIS
The Russell's Road To Recovery
08/18/08 12:00:20 PMby Ron Walker
The Russell 2000 (small cap stocks) has been on the road to recovery and is now testing the highs made in early June. It looks poised to clear June's overhead resistance in the near future, but might need a pullback to build the momentum to get the job done.
Position: N/A
| Since the July 15th lows several indexes have done exceptionally well, but there is one that stands out. The Russell 2000 has taken a leadership role, having risen approximately 18% from its intraday low made on July 15 to its intraday high made on Friday, August 15, having advanced 117 points since that intraday low. The Russell 2000 has risen for the past six consecutive weeks on its weekly chart. But on August 15, the Russell 2000 ran into key overhead resistance and could get a healthy pullback before the advance continues. |

|
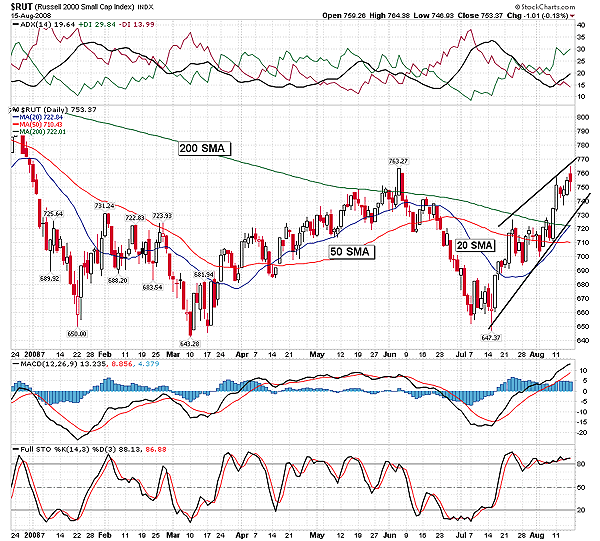
| FIGURE 1: $RUT, DAILY. The Russell is now above its 20-, 50-, and 200-day SMAs. If a pullback occurs, prices may find support where the 20-day SMA and 200-day SMA intersect near 722. The average directional movement index (ADX) is showing that the Russell is in a healthy rising trend, but the ADX line needs to rise above 20 for the advance to continue. |
| Graphic provided by: StockCharts.com. |
| |
| In Figure 1, the Russell 2000's daily chart reveals some very interesting things. First of all, during this advance the small-caps managed to close above their 50- and 200-day simple moving averages (SMAs) on the daily chart. That is a very strong sign. Previously in the early stages of the current advance, prices moved above the 20-day SMA. Currently, prices are well above the 20-day SMA. But during an uptrend, most reactions are contained at either the 20- or 50-day SMAs, so I do anticipate a pullback in the near future, especially because the Russell is running into overhead resistance near 764. That was the peak that was made in early June. We are likely witnessing an accelerated trendline; prices should pull back because the current angle of ascent is very steep. If the current rising wedge on the daily chart in Figure 1 breaks down, a reaction back to support could allow a new rising trend channel to develop. |

|
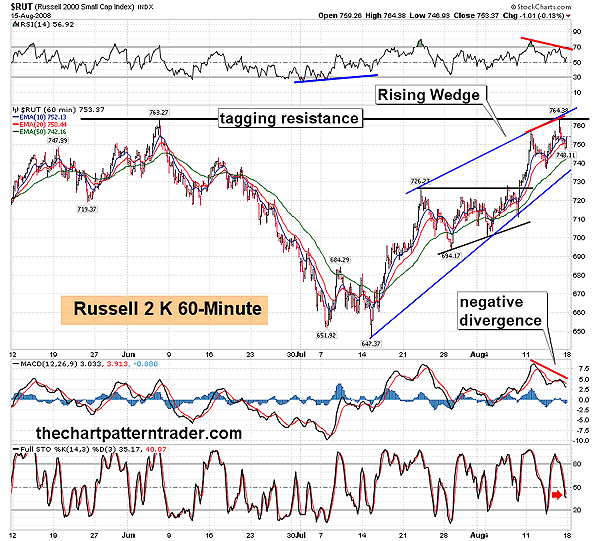
| FIGURE 2: $RUT, 60-MINUTE. The Russell 2000 has had a 18% move from its intraday low on July 15 to its intraday day on August 15. That is a 117 increase in one month. But negative divergence is looming over the 60-minute as the Russell 2000 has formed a bearish rising wedge pattern. |
| Graphic provided by: StockCharts.com. |
| |
| In Figure 2, the Russell 2000's 60-minute chart exposes the current weakness in price. The price rose up to overhead resistance at 764, forming a divergence between price and the relative strength index (RSI). Moreover, the divergence is on the moving average convergence/divergence (MACD) as well. The Russell rallied up but couldn't close above overhead resistance. Simple divergence such as we see here on the 60-minute chart forms when prices have moved up too quickly. A simple divergence doesn't mean that the advance is over; it is just a warning that prices are likely to experience a corrective move. |

|
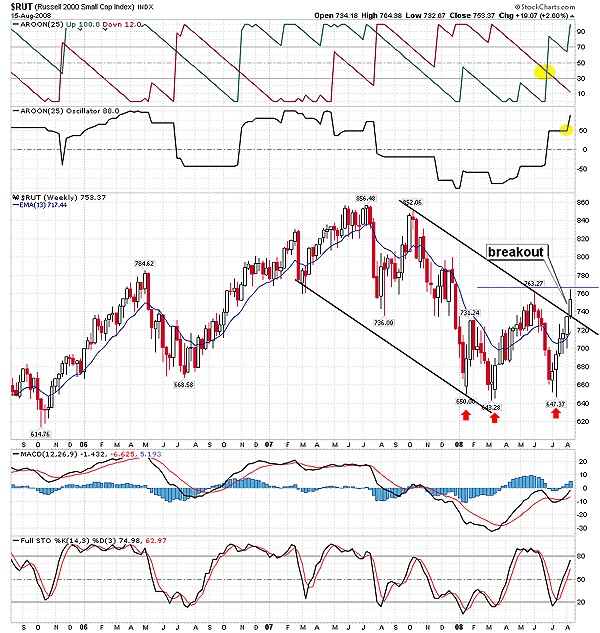
| FIGURE 3: $RUT, WEEKLY. The aroon on the Russell weekly chart has signaled that the small-caps are in a new uptrend, as the aroon upline (green line) crossed above the aroon downline (red line) (highlighted in yellow) and then moved above 70, as the aroon down dipped below 30. That is what occurs during a healthy rising trend. This move has also been confirmed by the aroon oscillator moving above +50 (highlighted in yellow). |
| Graphic provided by: StockCharts.com. |
| |
| On the weekly chart of the Russell 2000 (Figure 3), you will notice several bullish events have recently occurred in that time frame. The MACD made a higher low during the pullbacks in mid-July, confirming the higher low made on the weekly price chart. The MACD also looks poised to move above the zero line, which is very positive. The MACD histogram has been in positive territory for the last three weeks, showing that the bulls have taken back control. But most important is that the falling price channel was broken as the week closed on August 15. The weekly chart also has a rising 13-week exponential moving average (EMA). It also appears that the 764 area of resistance is the confirmation line to a triple bottom (see red arrows on Figure 3). Prices need to ultimately close above the May highs (the 764 level) in order for the July lows to hold up. |
| The odds favor that Russell 2000 will continue to take a leadership role, but for the short term it looks like the bearish rising wedge on its 60-minute chart will break down due to the negative divergence. If that happens, the market should follow suit. So we might start seeing some selling pressure for the short term, but once prices pull back, the weekly chart suggests that the advance will resume. |
Ron Walker is an active trader and technical analyst. He operates an educational website dedicated to the study of Technical Analysis. The website offers free market analysis with daily video presentations and written commentaries. Ron is a video pioneer, being one of the first to utilize the internet producing Technical Analysis videos. His website is thechartpatterntrader.com
| Website: | thechartpatterntrader.com |
| E-mail address: | thechartpatterntrader@gmail.com |
Click here for more information about our publications!
Comments
Date: 08/18/08Rank: 4Comment:
Date: 08/19/08Rank: 5Comment:
Date: 08/19/08Rank: 4Comment:

Request Information From Our Sponsors
- StockCharts.com, Inc.
- Candle Patterns
- Candlestick Charting Explained
- Intermarket Technical Analysis
- John Murphy on Chart Analysis
- John Murphy's Chart Pattern Recognition
- John Murphy's Market Message
- MurphyExplainsMarketAnalysis-Intermarket Analysis
- MurphyExplainsMarketAnalysis-Visual Analysis
- StockCharts.com
- Technical Analysis of the Financial Markets
- The Visual Investor
- VectorVest, Inc.
- Executive Premier Workshop
- One-Day Options Course
- OptionsPro
- Retirement Income Workshop
- Sure-Fire Trading Systems (VectorVest, Inc.)
- Trading as a Business Workshop
- VectorVest 7 EOD
- VectorVest 7 RealTime/IntraDay
- VectorVest AutoTester
- VectorVest Educational Services
- VectorVest OnLine
- VectorVest Options Analyzer
- VectorVest ProGraphics v6.0
- VectorVest ProTrader 7
- VectorVest RealTime Derby Tool
- VectorVest Simulator
- VectorVest Variator
- VectorVest Watchdog
