HOT TOPICS LIST
- MACD
- Fibonacci
- RSI
- Gann
- ADXR
- Stochastics
- Volume
- Triangles
- Futures
- Cycles
- Volatility
- ZIGZAG
- MESA
- Retracement
- Aroon
INDICATORS LIST
LIST OF TOPICS
PRINT THIS ARTICLE
by Mike Carr, CMT
It is possible to profit from relative strength charts, basing buy and sell decisions only on this indicator instead of looking at price.
Position: N/A
Mike Carr, CMT
Mike Carr, CMT, is a member of the Market Technicians Association, and editor of the MTA's newsletter, Technically Speaking. He is also the author of "Smarter Investing in Any Economy: The Definitive Guide to Relative Strength Investing," and "Conquering the Divide: How to Use Economic Indicators to Catch Stock Market Trends."
PRINT THIS ARTICLE
REL. STR COMPARATIVE
Trading Relative Strength Instead Of Price
08/18/08 09:13:06 AMby Mike Carr, CMT
It is possible to profit from relative strength charts, basing buy and sell decisions only on this indicator instead of looking at price.
Position: N/A
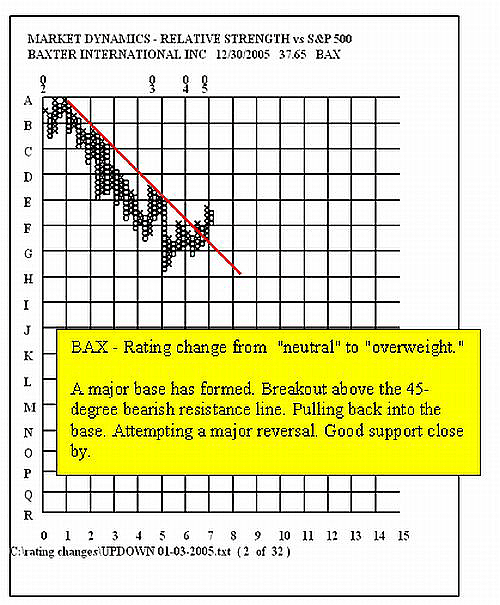
| At the end of 2005, analysts upgraded Baxter International (BAX) based on the fundamental outlook. At that time, BAX was on a buy signal based on a point & figure chart of relative strength (RS), as shown in Figure 1. These charts eliminate the day-to-day noise inherent in any indicator and allow the analyst to focus solely on the longer-term trend. We can see that BAX had recently begun to outperform the market and had in fact broken a long downtrend in RS. |

|
| FIGURE 1: BAX, RELATIVE STRENGTH VS. S&P 500. As fundamental analysts upgraded BAX, RS was breaking out and signaling a buy on the point & figure chart. |
| Graphic provided by: Market Dynamics. |
| |
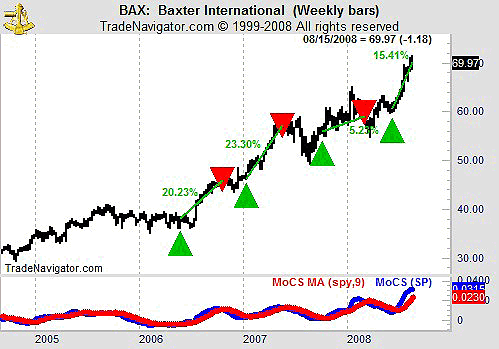
| Another RS indicator, the momentum of comparative strength (MOCS), can be used to time buys and sells based upon movements of RS. MOCS applies moving average convergence/divergence (MACD)-type calculations to RS and allows us to obtain precise trading signals. Combining this indicator with the point & figure chart of RS leads to high-probability trading signals. |

|
| FIGURE 2: BAX, WEEKLY. MOCS gives four buy signals, all winners with sells timed to allow the trader to keep the majority of the profits. |
| Graphic provided by: Trade Navigator. |
| |
| In this case, we buy BAX when MOCS crosses above its nine-period simple moving average. We sell when MOCS crosses below the moving average. With BAX on a RS buy based on the point & figure chart, there are four buy signals. Two gained more than 20%; one gained a little more than 5%; and the current trade is up by more than 15%. No trade suffered significant drawdown. |
| Without our even looking at price, these two RS indicators offer a powerful trading strategy that all traders should consider. |
Mike Carr, CMT, is a member of the Market Technicians Association, and editor of the MTA's newsletter, Technically Speaking. He is also the author of "Smarter Investing in Any Economy: The Definitive Guide to Relative Strength Investing," and "Conquering the Divide: How to Use Economic Indicators to Catch Stock Market Trends."
| Website: | www.moneynews.com/blogs/MichaelCarr/id-73 |
| E-mail address: | marketstrategist@gmail.com |
Click here for more information about our publications!
Comments

|

Request Information From Our Sponsors
- VectorVest, Inc.
- Executive Premier Workshop
- One-Day Options Course
- OptionsPro
- Retirement Income Workshop
- Sure-Fire Trading Systems (VectorVest, Inc.)
- Trading as a Business Workshop
- VectorVest 7 EOD
- VectorVest 7 RealTime/IntraDay
- VectorVest AutoTester
- VectorVest Educational Services
- VectorVest OnLine
- VectorVest Options Analyzer
- VectorVest ProGraphics v6.0
- VectorVest ProTrader 7
- VectorVest RealTime Derby Tool
- VectorVest Simulator
- VectorVest Variator
- VectorVest Watchdog
- StockCharts.com, Inc.
- Candle Patterns
- Candlestick Charting Explained
- Intermarket Technical Analysis
- John Murphy on Chart Analysis
- John Murphy's Chart Pattern Recognition
- John Murphy's Market Message
- MurphyExplainsMarketAnalysis-Intermarket Analysis
- MurphyExplainsMarketAnalysis-Visual Analysis
- StockCharts.com
- Technical Analysis of the Financial Markets
- The Visual Investor
