HOT TOPICS LIST
- MACD
- Fibonacci
- RSI
- Gann
- ADXR
- Stochastics
- Volume
- Triangles
- Futures
- Cycles
- Volatility
- ZIGZAG
- MESA
- Retracement
- Aroon
INDICATORS LIST
LIST OF TOPICS
PRINT THIS ARTICLE
by Alan R. Northam
Chevron has been in a new downward trend since mid-May but is now starting to head upward. This upward movement must be considered corrective and not the resumption of an upward trend.
Position: N/A
Alan R. Northam
Alan Northam lives in the Dallas, Texas area and as an electronic engineer gave him an analytical mind from which he has developed a thorough knowledge of stock market technical analysis. His abilities to analyze the future direction of the stock market has allowed him to successfully trade of his own portfolio over the last 30 years. Mr. Northam is now retired and trading the stock market full time. You can reach him at inquiry@tradersclassroom.com or by visiting his website at http://www.tradersclassroom.com. You can also follow him on Twitter @TradersClassrm.
PRINT THIS ARTICLE
ELLIOTT WAVE
Chevron Corrects Its Losses
08/15/08 01:38:04 PMby Alan R. Northam
Chevron has been in a new downward trend since mid-May but is now starting to head upward. This upward movement must be considered corrective and not the resumption of an upward trend.
Position: N/A
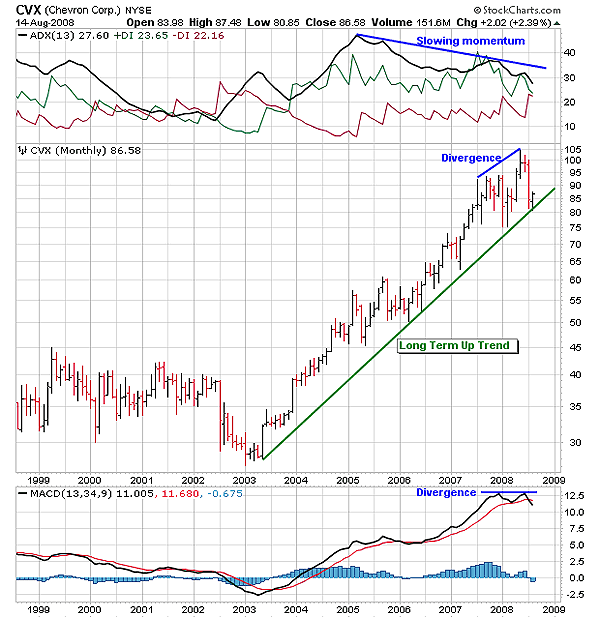
| Figure 1 shows the monthly chart for Chevron Corp. (CVX). This chart shows that CVX has been in a long-term uptrend since 2003, but that may be about to change. The average directional movement index (ADX), above the price chart, shows that the momentum of this stock has been slowing since 2005 and has recently fallen below its 30 level. This indicates that the upward trend has lost momentum. Note that a market is considered to be trending when ADX is above 20 and is considered to be a strong trend when ADX is above 30. Below the price chart is the moving average convergence/divergence (MACD) chart. This chart shows MACD as having formed a double-top formation and has now moved below the low of the valley between the two peaks, thus confirming a top for MACD, indicating that MACD should move lower from here. Also note that at the same time, the price chart shows the price continuing to move higher. This is a negative divergence. When an indicator such as the MACD does not move higher along with price, a divergence occurs, signaling a loss of underlying market strength. While not 100% perfect, divergences are a reliable indicator of a market that is about to change directions. Therefore, the loss of momentum and the divergence between price and and its indicator suggests a high probability that the long-term uptrend could be in danger. |

|
| FIGURE 1: CVX, MONTHLY. This price chart shows the long-term uptrend that started in 2003. This chart also shows the loss of momentum and a divergence that normally precedes a change in trend. |
| Graphic provided by: StockCharts.com. |
| |
| One of the best ways to determine if a trend is ending is to look at the wave structure of the corrective wave. Looking at the monthly chart, we can see that CVX peaked in May and has been in a corrective mode over the last two months. If we look at the details of the wave structure of this correction, we can learn some valuable information. If the market corrects in a three-wave ABC zigzag fashion, then the selloff, in the case of CVX, is corrective and once completed, this market should continue making new higher highs. However, if the selloff unfolds in five downward nonoverlapping waves, then the selloff is most likely not a correction but the beginning of a downward trend. |
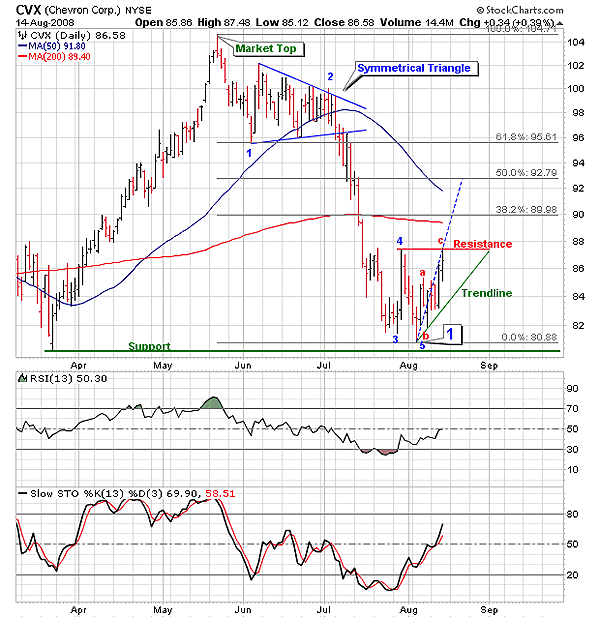
| Figure 2 is that of the daily price chart over the last five months. Note that CVX has moved downward in five nonoverlapping waves. Wave 1 was the first move lower from the market top. Wave 2 was a sideways corrective affair that unfolded as a symmetrical triangle. Symmetrical triangles are typically continuation patterns and signals that the downward trend from the market top should most likely continue. Wave 3 down is typically the wave that moves the furthest distance in the shortest period of time. Thus, wave 3 has lived up to its reputation and I feel very confident in labeling wave 3 as such. Wave 4 is another corrective wave. One of the things Elliotticians look for is a comparison between corrective waves 2 and 4. If wave 2 is a long-drawn-out affair, then wave 4 usually plays out swiftly and visa versa: This is known as an alternation. And as we can see, wave 2 took almost a month to complete, whereas wave 4 took one trading session. Another thing Elliotticians look for is the relationship between wave 1 and wave 4. The price peak of wave 4 is not allowed to overlap the price minimum of wave 1, and as you can see, these two waves are nonoverlapping. Wave 5 is the last wave down and is usually about the same length as wave 1. Based upon these characteristics, I am confident in labeling the market decline from mid-May as an impulse wave made up of five nonoverlapping waves. An impulse wave then defines the direction of the next larger impulse wave. This means that the first five waves down make up wave 1 of a larger impulse wave. Therefore, the move down from the market top does not look corrective at all, but instead looks like the beginning of a new downward market trend. |

|
| FIGURE 2: CVX, DAILY. This price chart shows five nonoverlapping waves in the downward direction. these five waves point in the direction of the larger trend, which is down. This chart also shows that CVX is currently undergoing a corrective rally that when complete will signal the continuation of the downtrend. |
| Graphic provided by: StockCharts.com. |
| |
| In early August, CVX started moving upward again. If the five waves down indicate that the direction of this market is now downward, then the move upward in August must be corrective. I have labeled the advance to date as an ABC zigzag corrective move. Corrective moves normally end in the vicinity of the previous wave 3 and wave 4. I have drawn a resistance line at the top of wave 4. As you can see, CVX has rallied up to the top of wave 4 in an ABC zigzag fashion and has thus met the requirements of a complete corrective rally. Therefore, CVX could turn back downward at any time. However, when I look at the stochastic and relative strength index (RSI) oscillators, I note that they are still below their 80 and 70 lines and are still pointing higher. This is an indication that CVX is not yet overbought and may still move higher in the days ahead. For this reason I have also added the Fibonacci retracement levels to Figure 2. These levels show areas where markets normally rally up to in market corrections before turning back downward. The most common retracement level is the 50% line and I have drawn a blue dotted line from the August low up to this retracement level. If CVX continues to move higher from here, then the 50% retracement level is a good place to look for CVX to turn back down. I have also drawn a green upward-sloping trendline off the August low. A break of this trendline will be a good indication that the corrective rally has ended and the downtrend has resumed. |
| In conclusion, CVX looks as if it made a major market top in May of this year and is now starting a new downward market trend. The current rally off the August low therefore must be considered to be corrective, and although it has met all the requirements of a market correction, there does exist a high probability that the market correction is not over. Once the market correction ends, CVX should then turn back down to make new lower low prices. However, should CVX continue higher and make a new market high, then CVX is still in a bull market. Look for a break below the upward-sloping trendline as a signal that the downtrend has resumed. |
Alan Northam lives in the Dallas, Texas area and as an electronic engineer gave him an analytical mind from which he has developed a thorough knowledge of stock market technical analysis. His abilities to analyze the future direction of the stock market has allowed him to successfully trade of his own portfolio over the last 30 years. Mr. Northam is now retired and trading the stock market full time. You can reach him at inquiry@tradersclassroom.com or by visiting his website at http://www.tradersclassroom.com. You can also follow him on Twitter @TradersClassrm.
| Garland, Tx | |
| Website: | www.tradersclassroom.com |
| E-mail address: | inquiry@tradersclassroom.com |
Click here for more information about our publications!
Comments

|

Request Information From Our Sponsors
- StockCharts.com, Inc.
- Candle Patterns
- Candlestick Charting Explained
- Intermarket Technical Analysis
- John Murphy on Chart Analysis
- John Murphy's Chart Pattern Recognition
- John Murphy's Market Message
- MurphyExplainsMarketAnalysis-Intermarket Analysis
- MurphyExplainsMarketAnalysis-Visual Analysis
- StockCharts.com
- Technical Analysis of the Financial Markets
- The Visual Investor
- VectorVest, Inc.
- Executive Premier Workshop
- One-Day Options Course
- OptionsPro
- Retirement Income Workshop
- Sure-Fire Trading Systems (VectorVest, Inc.)
- Trading as a Business Workshop
- VectorVest 7 EOD
- VectorVest 7 RealTime/IntraDay
- VectorVest AutoTester
- VectorVest Educational Services
- VectorVest OnLine
- VectorVest Options Analyzer
- VectorVest ProGraphics v6.0
- VectorVest ProTrader 7
- VectorVest RealTime Derby Tool
- VectorVest Simulator
- VectorVest Variator
- VectorVest Watchdog
