HOT TOPICS LIST
- MACD
- Fibonacci
- RSI
- Gann
- ADXR
- Stochastics
- Volume
- Triangles
- Futures
- Cycles
- Volatility
- ZIGZAG
- MESA
- Retracement
- Aroon
INDICATORS LIST
LIST OF TOPICS
PRINT THIS ARTICLE
by Mike Carr, CMT
Buying stocks that hit new highs is a technique commonly employed by traders to catch the next big winner. Relative strength can be used to avoid buying overbought stocks likely to consolidate or decline in the short term.
Position: Buy
Mike Carr, CMT
Mike Carr, CMT, is a member of the Market Technicians Association, and editor of the MTA's newsletter, Technically Speaking. He is also the author of "Smarter Investing in Any Economy: The Definitive Guide to Relative Strength Investing," and "Conquering the Divide: How to Use Economic Indicators to Catch Stock Market Trends."
PRINT THIS ARTICLE
REL. STR COMPARATIVE
Buying Breakouts
08/13/08 08:38:40 AMby Mike Carr, CMT
Buying stocks that hit new highs is a technique commonly employed by traders to catch the next big winner. Relative strength can be used to avoid buying overbought stocks likely to consolidate or decline in the short term.
Position: Buy
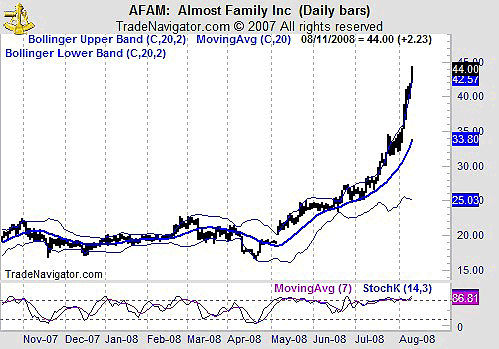
| As the market races higher, traders worry about missing out on the rapid gains possible from owning the highest momentum stocks. Successful traders temper their enthusiasm with the realization that losses can occur just as quickly as gains with these stocks. Traditionally, stop-losses have been employed to limit the risk. But buying smarter can lead to even larger gains with less risk. Comparing two stocks will illustrate this technique. Almost Family (AFAM) is clearly a strong stock (Figure 1). Daily prices have broken through the upper Bollinger band and stochastics is overbought and looks very strong. |

|
| FIGURE 1: AFAM, DAILY. This stock has been a strong performer and shows no imminent signs of weaker performance. |
| Graphic provided by: Trade Navigator. |
| |
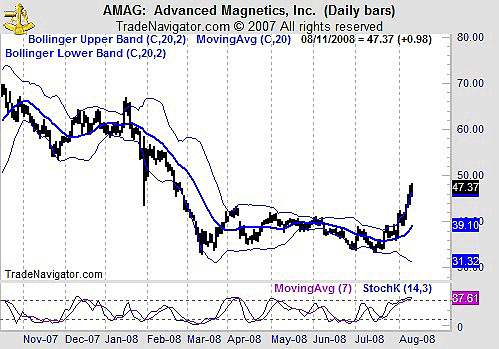
| The exact same technical scan also identifies Advanced Magnetics (AMAG) as a potential buy (Figure 2). The price pattern differs in that the stock is recovering from an extended decline. However, both stocks have recently broken out of extended bases and the point & figure charts (not shown) offer price targets that have not been reached. Based upon a simple screen, both stocks make the buy list. |

|
| FIGURE 2: AMAG, DAILY. This chart has cleared resistance and shows a price target near 70. |
| Graphic provided by: Trade Navigator. |
| |
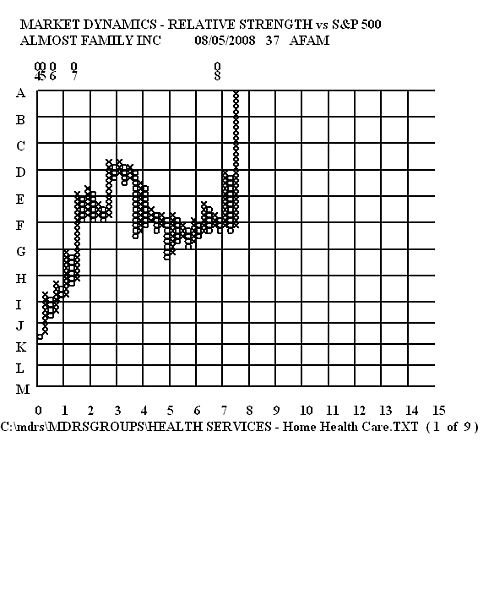
| Looking closer at relative strength (RS), we see in Figure 3 that AFAM is overextended. The chart shows the RS as a point & figure chart that removes the day-to-day noise of the market. This provides a clearer view of how the stock has performed, and we see that this stock may be ahead of itself. |

|
| FIGURE 3: AFAM, RELATIVE STRENGTH. The relative strength of AFAM is strong, but it likely needs to consolidate before moving higher. |
| Graphic provided by: Market Dynamics. |
| |
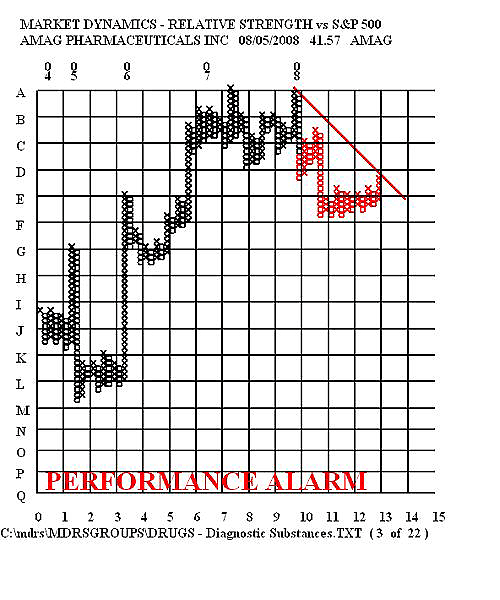
| In Figure 4, we look at the same type of chart for AMAG. Here we see RS challenging the downtrend line after completing a base, a much stronger pattern likely to lead to continued gains. |

|
| FIGURE 4: AMAG, RELATIVE STRENGTH. After clearing a small base, the RS of AMAG is likely to move higher. If the market also moves higher, buying AMAG should lead to market-beating gains. |
| Graphic provided by: Market Dynamics. |
| |
| Looking deeper at RS, we see that all breakouts and all high RS stocks are not created equal. In this case, AMAG is likely to deliver larger gains than AFAM. |
Mike Carr, CMT, is a member of the Market Technicians Association, and editor of the MTA's newsletter, Technically Speaking. He is also the author of "Smarter Investing in Any Economy: The Definitive Guide to Relative Strength Investing," and "Conquering the Divide: How to Use Economic Indicators to Catch Stock Market Trends."
| Website: | www.moneynews.com/blogs/MichaelCarr/id-73 |
| E-mail address: | marketstrategist@gmail.com |
Click here for more information about our publications!
PRINT THIS ARTICLE

Request Information From Our Sponsors
- VectorVest, Inc.
- Executive Premier Workshop
- One-Day Options Course
- OptionsPro
- Retirement Income Workshop
- Sure-Fire Trading Systems (VectorVest, Inc.)
- Trading as a Business Workshop
- VectorVest 7 EOD
- VectorVest 7 RealTime/IntraDay
- VectorVest AutoTester
- VectorVest Educational Services
- VectorVest OnLine
- VectorVest Options Analyzer
- VectorVest ProGraphics v6.0
- VectorVest ProTrader 7
- VectorVest RealTime Derby Tool
- VectorVest Simulator
- VectorVest Variator
- VectorVest Watchdog
- StockCharts.com, Inc.
- Candle Patterns
- Candlestick Charting Explained
- Intermarket Technical Analysis
- John Murphy on Chart Analysis
- John Murphy's Chart Pattern Recognition
- John Murphy's Market Message
- MurphyExplainsMarketAnalysis-Intermarket Analysis
- MurphyExplainsMarketAnalysis-Visual Analysis
- StockCharts.com
- Technical Analysis of the Financial Markets
- The Visual Investor
