HOT TOPICS LIST
- MACD
- Fibonacci
- RSI
- Gann
- ADXR
- Stochastics
- Volume
- Triangles
- Futures
- Cycles
- Volatility
- ZIGZAG
- MESA
- Retracement
- Aroon
INDICATORS LIST
LIST OF TOPICS
PRINT THIS ARTICLE
by Alan R. Northam
Oil is now in an established downward market correction that could see oil drop to $81.50 per barrel. There exists a possibility that oil could fall even further.
Position: N/A
Alan R. Northam
Alan Northam lives in the Dallas, Texas area and as an electronic engineer gave him an analytical mind from which he has developed a thorough knowledge of stock market technical analysis. His abilities to analyze the future direction of the stock market has allowed him to successfully trade of his own portfolio over the last 30 years. Mr. Northam is now retired and trading the stock market full time. You can reach him at inquiry@tradersclassroom.com or by visiting his website at http://www.tradersclassroom.com. You can also follow him on Twitter @TradersClassrm.
PRINT THIS ARTICLE
FIBONACCI
Could Oil Fall Even Further?
08/12/08 08:57:16 AMby Alan R. Northam
Oil is now in an established downward market correction that could see oil drop to $81.50 per barrel. There exists a possibility that oil could fall even further.
Position: N/A
| On July 23 I published an article entitled "Is The Oil Uptrend Over?" There I showed that the Intermediate-term uptrend line had been broken, ending the intermediate-term upward trend. I also pointed out that once the intermediate-term trendline was broken, it ushered in a market correction in oil. I further mentioned that market corrections normally take the shape of an ABC zigzag wave formation. I encourage all to reread this article to better understand the details of my analysis on oil. |
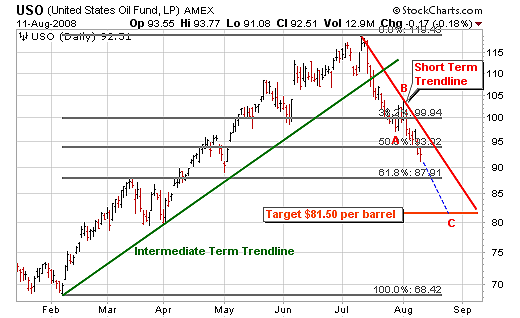
| Since that article, oil has continued to fall in price as expected and has now fallen to just below the Fibonacci retracement level of 50%. This indicates that oil has now lost half of its price increase from the rally that started last February. In so doing, oil has also traced out waves A and B of the ABC zigzag correction that I pointed out should occur. With waves A and B now complete, this leaves wave C yet to be completed. (See Figure 1.) |

|
| FIGURE 1: US OIL FUND, DAILY. This figure shows that the intermediate-term uptrend has ended and oil is now in a market correction that could see oil fall to $81.50 per barrel. |
| Graphic provided by: StockCharts.com. |
| |
| With waves A and B now complete, it is possible to determine a target price for oil that could complete the market correction. To determine this price target, we simply take the length of wave A and subtract it from the price maximum of wave B. The result of this calculation then gives a price target for oil of $81.50 per barrel. Although $81.50 per barrel is a good price target, there exists the possibility that oil could correct even further. Allow me to explain: Corrective rallies are sometimes complex affairs and do not always print out a simple ABC zigzag wave pattern. Sometimes, these wave patterns can morph into more complex corrective waves, and therefore, we must be on guard for such an occurrence. Further, it is possible that the current wave pattern development is not an ABC corrective wave after all. It could turn out to be waves 1 and 2 of a downsloping impulse wave that, according to the Elliott wave theory, determines the direction of the next larger impulse wave. Should the waveform turn out to be an impulse wave, that will signal that the major trend in oil is in the downward direction and that the current selloff is not a correction but a new downward trend. Impulse waves are made up of five nonoverlapping waves: wave 1 down, a corrective wave 2, wave 3 down, a second corrective wave 4, and wave 5 a final wave down. |
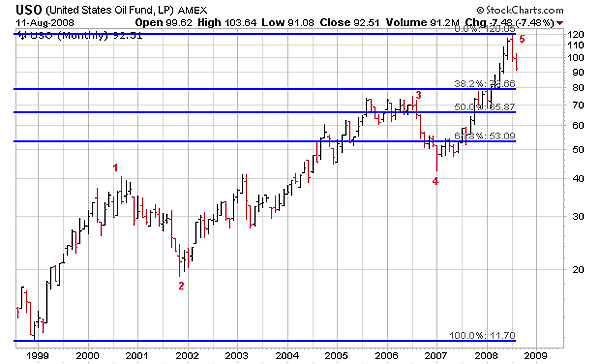
| Figure 2 is that of the monthly price chart of oil. This chart shows the Fibonacci retracement levels for the complete rise in price for the bull market in oil that started in 1999. Note that the $81.50 price target is right at the 38.2% retracement level. However, should the market correction morph into a more complex wave pattern, then expect the price of oil to possibly fall to either the 50% retracement level or even the 61.8% retracement level. This means that if oil does continue to sell off, it could fall to as low as $53 per barrel. As an additional note, according to Elliott wave, market corrections typically move into the price territory of the previous waves 3 and 4. This indicates that the price of oil should drop to around $40 to $75 per barrel before the correction is over. |

|
| FIGURE 2: USO, MONTHLY. This chart shows the typical Fibonacci retracement levels for the complete bull market rally from 1999. This chart further shows that the price of oil could drop to as much as $53 per barrel before the market correction is complete. |
| Graphic provided by: StockCharts.com. |
| |
| In conclusion, the intermediate-term uptrend in oil that started in February has ended and the oil market has entered into a corrective phase. This corrective phase is expected to continue with a near-term price target of $81.50 per barrel of oil. However, there does exist the possibility that the current market correction could morph into a more complex form that could see oil continue to fall to as low as $40 to $70 per barrel. |
Alan Northam lives in the Dallas, Texas area and as an electronic engineer gave him an analytical mind from which he has developed a thorough knowledge of stock market technical analysis. His abilities to analyze the future direction of the stock market has allowed him to successfully trade of his own portfolio over the last 30 years. Mr. Northam is now retired and trading the stock market full time. You can reach him at inquiry@tradersclassroom.com or by visiting his website at http://www.tradersclassroom.com. You can also follow him on Twitter @TradersClassrm.
| Garland, Tx | |
| Website: | www.tradersclassroom.com |
| E-mail address: | inquiry@tradersclassroom.com |
Click here for more information about our publications!
Comments
Date: 08/22/08Rank: 5Comment:

Request Information From Our Sponsors
- StockCharts.com, Inc.
- Candle Patterns
- Candlestick Charting Explained
- Intermarket Technical Analysis
- John Murphy on Chart Analysis
- John Murphy's Chart Pattern Recognition
- John Murphy's Market Message
- MurphyExplainsMarketAnalysis-Intermarket Analysis
- MurphyExplainsMarketAnalysis-Visual Analysis
- StockCharts.com
- Technical Analysis of the Financial Markets
- The Visual Investor
- VectorVest, Inc.
- Executive Premier Workshop
- One-Day Options Course
- OptionsPro
- Retirement Income Workshop
- Sure-Fire Trading Systems (VectorVest, Inc.)
- Trading as a Business Workshop
- VectorVest 7 EOD
- VectorVest 7 RealTime/IntraDay
- VectorVest AutoTester
- VectorVest Educational Services
- VectorVest OnLine
- VectorVest Options Analyzer
- VectorVest ProGraphics v6.0
- VectorVest ProTrader 7
- VectorVest RealTime Derby Tool
- VectorVest Simulator
- VectorVest Variator
- VectorVest Watchdog
