HOT TOPICS LIST
- MACD
- Fibonacci
- RSI
- Gann
- ADXR
- Stochastics
- Volume
- Triangles
- Futures
- Cycles
- Volatility
- ZIGZAG
- MESA
- Retracement
- Aroon
INDICATORS LIST
LIST OF TOPICS
PRINT THIS ARTICLE
by James Kupfer
While the US dollar has been undeniably strong recently, it is now at a critical juncture that may temporarily halt its uptrend.
Position: Sell
James Kupfer
Mr. Kupfer is a market professional and amateur stock market commentator. Disclosure: It is likely that Mr. Kupfer has or will enter a position in any security he writes about.
PRINT THIS ARTICLE
LIN. REGTREND
The Dollar Is At A Critical Juncture
08/11/08 10:14:00 AMby James Kupfer
While the US dollar has been undeniably strong recently, it is now at a critical juncture that may temporarily halt its uptrend.
Position: Sell
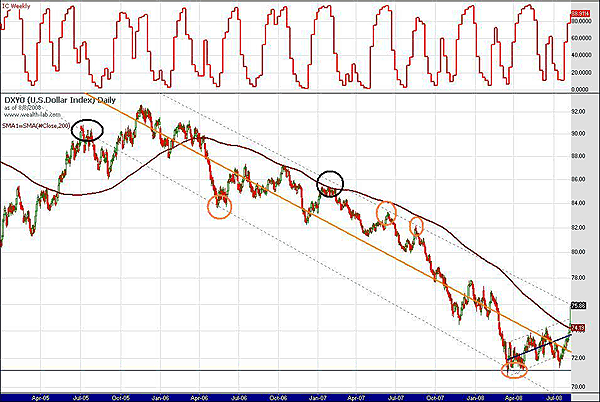
| First off, I'd like to focus on a longer-term chart of the US Dollar Index. From the top in October–November 2005, I've drawn a linear regression channel (orange line is the center) that encompasses almost all of the price action through Friday's close. You can see that in four previous instances marked by orange circles that prices have touched the channel boundary and then bounced back to stay within the channel. There are two additional instances (black circles) that we could argue also constitute tests or part of the formation of the channel. Even ignoring these last two, it is clear that the dollar has been in an extended downward channel. The dollar has now risen to the top of the long-term channel. See Figure 1. |

|
| FIGURE 1: USD, DAILY. The orange line is the center that encompasses almost all of the price action. |
| Graphic provided by: Wealth-Lab. |
| |
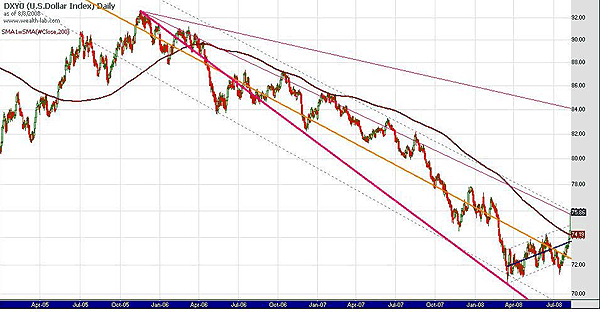
| Figure 2 shows a slightly modified view of the same chart with a speed resistance line added. For this, I used the 2005 top and the 2008 bottom. The speed resistance line, in pink, is very close to the top of the linear regression channel. As of Friday's close, prices are now a few pennies above the SR line. This line may act as further resistance to any upward move in price. |

|
| FIGURE 2: USD, DAILY. The speed resistance line, in pink, is very close to the top of the linear regression channel. |
| Graphic provided by: Wealth-Lab. |
| |
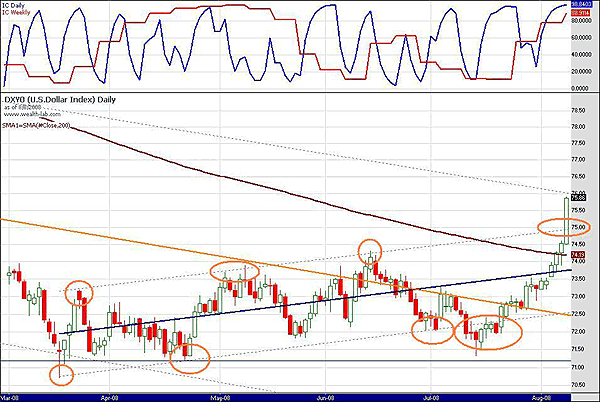
| Moving along to a closer view of the daily chart in Figure 3, you can see that prices have moved to within a few cents of the long-term down channel identified previously (top dotted line). I have also included another linear regression channel of the dollar that I first described on June 3. The regression channel has held up among multiple tests. Note, however, that it has been a countertrend channel up within the long-term down channel. On Friday, prices moved sharply above the short-term channel boundary. I would not yet classify this as a full breakout, but it is encouraging if you are long the dollar. Unfortunately, this also puts the dollar in a precarious position that must be resolved. The dollar is now in a position where it is trying to break through a long-term downtrend where it is overbought on both a daily and weekly perspective. In addition, it is up against a speed resistance line. If it fails this test now, it would likely return to the bottom of the up channel around $73–72.50 before making another attempt at new highs. |

|
| FIGURE 3: USD, DAILY. Prices have moved to within a few cents of the long-term down channel identified previously (top dotted line). |
| Graphic provided by: Wealth-Lab. |
| |
| While I do think the dollar has made a long-term bottom, I'm not sure it is ready to break to new highs just yet. So trade with caution and consider that this might be a good opportunity to take profits. If prices do continue up and a breakout is made, look for the speed resistance line and linear regression channel to become the new support level of the dollar. |
Mr. Kupfer is a market professional and amateur stock market commentator. Disclosure: It is likely that Mr. Kupfer has or will enter a position in any security he writes about.
Click here for more information about our publications!
Comments
Date: 08/12/08Rank: 4Comment:

Request Information From Our Sponsors
- StockCharts.com, Inc.
- Candle Patterns
- Candlestick Charting Explained
- Intermarket Technical Analysis
- John Murphy on Chart Analysis
- John Murphy's Chart Pattern Recognition
- John Murphy's Market Message
- MurphyExplainsMarketAnalysis-Intermarket Analysis
- MurphyExplainsMarketAnalysis-Visual Analysis
- StockCharts.com
- Technical Analysis of the Financial Markets
- The Visual Investor
- VectorVest, Inc.
- Executive Premier Workshop
- One-Day Options Course
- OptionsPro
- Retirement Income Workshop
- Sure-Fire Trading Systems (VectorVest, Inc.)
- Trading as a Business Workshop
- VectorVest 7 EOD
- VectorVest 7 RealTime/IntraDay
- VectorVest AutoTester
- VectorVest Educational Services
- VectorVest OnLine
- VectorVest Options Analyzer
- VectorVest ProGraphics v6.0
- VectorVest ProTrader 7
- VectorVest RealTime Derby Tool
- VectorVest Simulator
- VectorVest Variator
- VectorVest Watchdog
