HOT TOPICS LIST
- MACD
- Fibonacci
- RSI
- Gann
- ADXR
- Stochastics
- Volume
- Triangles
- Futures
- Cycles
- Volatility
- ZIGZAG
- MESA
- Retracement
- Aroon
INDICATORS LIST
LIST OF TOPICS
PRINT THIS ARTICLE
by Mike Carr, CMT
While analysts have been calling for a bottom in the US dollar for some time, this time might be different.
Position: Buy
Mike Carr, CMT
Mike Carr, CMT, is a member of the Market Technicians Association, and editor of the MTA's newsletter, Technically Speaking. He is also the author of "Smarter Investing in Any Economy: The Definitive Guide to Relative Strength Investing," and "Conquering the Divide: How to Use Economic Indicators to Catch Stock Market Trends."
PRINT THIS ARTICLE
STRATEGIES
Dollar Bottom?
08/08/08 09:07:42 AMby Mike Carr, CMT
While analysts have been calling for a bottom in the US dollar for some time, this time might be different.
Position: Buy
| Global economies are linked together and a slowdown in one region will affect others. China's stock market is down about 50% year to date amid reports of economic slowing and inflationary pressures. Europe is seeing the same troubling signs and English monetary authorities are saying that a slowdown, and probably a recession, is inevitable. With weakening fundamentals in riskier nations, it seems likely the US dollar will return to its traditional role as a safe haven and this provides fundamental support for a higher dollar. |
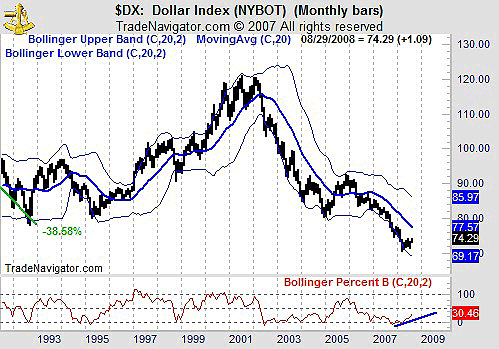
| The long-term chart of the US Dollar Index (Figure 1) shows the magnitude of the price decline. All momentum oscillators are severely oversold as we would expect in a bear market. In oversold or overbought markets, Bollinger bands offer a useful analytical technique. In this case, Bollinger PercentB is showing a bullish divergence. PercentB measures where price is relative to the Bollinger bands. A bullish divergence indicates that prices have moved higher on a relative basis and these divergences often precede price advances. |

|
| FIGURE 1: $DX, MONTHLY. The monthly chart of the US Dollar Index shows a deeply oversold condition after an extended bear market. |
| Graphic provided by: Trade Navigator. |
| |
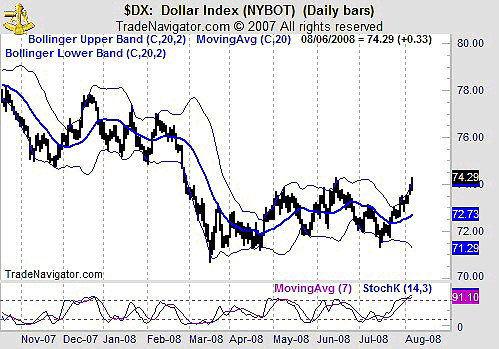
| The daily chart (Figure 2) also offers bullish support. Prices have risen sharply since the July test of earlier lows. Prices have broken through 74, an area of past resistance. The stochastics is overbought and this is common in strongly trending markets. With prices just above the upper Bollinger band, a consolidation can be expected, which offers an opportunity to build positions. |

|
| FIGURE 2: $DX, DAILY. The daily chart of the US Dollar Index shows signs that a bottom is in place. |
| Graphic provided by: Trade Navigator. |
| |
| Buying the dollar at current levels offers a low-risk entry point. The 20-day moving average offers a nearby stop loss for futures traders. Stock investors can use the PowerShares DB US Dollar Index Bullish (UUP) exchange traded fund, again using the 20-day moving average as a stop. |
Mike Carr, CMT, is a member of the Market Technicians Association, and editor of the MTA's newsletter, Technically Speaking. He is also the author of "Smarter Investing in Any Economy: The Definitive Guide to Relative Strength Investing," and "Conquering the Divide: How to Use Economic Indicators to Catch Stock Market Trends."
| Website: | www.moneynews.com/blogs/MichaelCarr/id-73 |
| E-mail address: | marketstrategist@gmail.com |
Click here for more information about our publications!
Comments
Date: 08/08/08Rank: 5Comment: Hello Mike, Great call. Saw it myself but slightly differently. Looking at the EUR the is a classic double top (one for the album) and it broke its pattern of rising bottoms for the first time since the low in 2005.
Th problem is, this pattern only counst to the first support at 1.49. Maybe its just an interruption.
Best regards
Date: 08/12/08Rank: 5Comment:

Request Information From Our Sponsors
- VectorVest, Inc.
- Executive Premier Workshop
- One-Day Options Course
- OptionsPro
- Retirement Income Workshop
- Sure-Fire Trading Systems (VectorVest, Inc.)
- Trading as a Business Workshop
- VectorVest 7 EOD
- VectorVest 7 RealTime/IntraDay
- VectorVest AutoTester
- VectorVest Educational Services
- VectorVest OnLine
- VectorVest Options Analyzer
- VectorVest ProGraphics v6.0
- VectorVest ProTrader 7
- VectorVest RealTime Derby Tool
- VectorVest Simulator
- VectorVest Variator
- VectorVest Watchdog
- StockCharts.com, Inc.
- Candle Patterns
- Candlestick Charting Explained
- Intermarket Technical Analysis
- John Murphy on Chart Analysis
- John Murphy's Chart Pattern Recognition
- John Murphy's Market Message
- MurphyExplainsMarketAnalysis-Intermarket Analysis
- MurphyExplainsMarketAnalysis-Visual Analysis
- StockCharts.com
- Technical Analysis of the Financial Markets
- The Visual Investor
