HOT TOPICS LIST
- MACD
- Fibonacci
- RSI
- Gann
- ADXR
- Stochastics
- Volume
- Triangles
- Futures
- Cycles
- Volatility
- ZIGZAG
- MESA
- Retracement
- Aroon
INDICATORS LIST
LIST OF TOPICS
PRINT THIS ARTICLE
by Alan R. Northam
The NASDAQ appears to be forming a double-bottom trend reversal pattern, but by a more detailed analysis, the future direction of this market still looks downward.
Position: N/A
Alan R. Northam
Alan Northam lives in the Dallas, Texas area and as an electronic engineer gave him an analytical mind from which he has developed a thorough knowledge of stock market technical analysis. His abilities to analyze the future direction of the stock market has allowed him to successfully trade of his own portfolio over the last 30 years. Mr. Northam is now retired and trading the stock market full time. You can reach him at inquiry@tradersclassroom.com or by visiting his website at http://www.tradersclassroom.com. You can also follow him on Twitter @TradersClassrm.
PRINT THIS ARTICLE
DOUBLE BOTTOMS
NASDAQ Double Bottom?
08/08/08 09:01:13 AMby Alan R. Northam
The NASDAQ appears to be forming a double-bottom trend reversal pattern, but by a more detailed analysis, the future direction of this market still looks downward.
Position: N/A
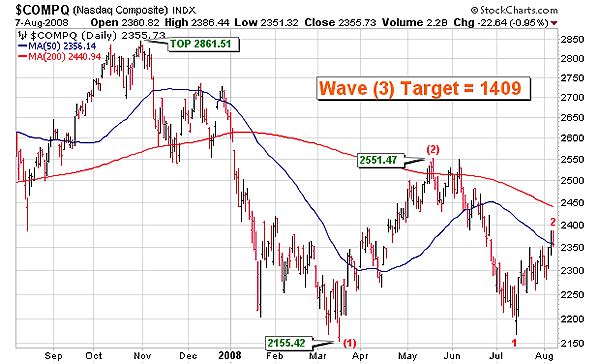
| Figure 1 shows the daily price chart for the NASDAQ over the course of the last two years. This chart shows that the NASDAQ made a major market top in October 2007. The chart also shows that the NASDAQ made a bottom in March 2008 and and another bottom in July. Looking here, a market technician might draw the conclusion that the NASDAQ is forming a double bottom. Double-bottom formations as well as double-top formations often occur after a significant market selloff or rally and signal the end of a move and a reversal in trend. Looking at the chart, it is easy to jump to a conclusion that the NASDAQ has now completed its move downward and is ready to reverse its trend and start a new trend upward. Confirmation of a trend reversal would normally occur once the market traded above the price peak between the two market lows. Therefore, market technicians who are watching for confirmation that the market has reversed its trend are looking for a move above 2550 to confirm their suspicions. However, a closer look at the wave structure during the last rally from the mid-July price low will reveal that this may not be a double bottom after all. Before we look at this latest rally in more detail, allow me to analyze this market from the market top forward using the Elliott wave principle. |

|
| FIGURE 1: NASDAQ, DAILY. Here's the price chart of the NASDAQ market index showing the Elliott wave count and moving averages. This chart shows that wave (3) down is under way with a price target of 1409. |
| Graphic provided by: StockCharts.com. |
| |
| From the market top made last year in October 2007, I see that the market has moved down in five waves to complete impulse wave (1). A five-wave move defines the direction of the next larger Impulse. Since the direction of the five-wave move is downward, this then defines the direction of the next larger Impulse as also being downward. This next larger impulse is made up of wave (1) down, wave (2) a corrective wave, wave (3) down, wave (4) another corrective wave, and a final wave (5) down. From the chart, we can see that the market has completed wave (1) and corrective wave (2). This leaves waves (3), (4), and (5) to be complete in the down direction. Further, with waves (1) and (2) down now complete, wave (3) down is now under way. Due to the fractal nature of waves, wave (3) down will also be made up of five waves. Of those five waves, wave 1 down is complete and wave 2 is either still in progress or is now complete. We will look at the details of wave 2 below. Once wave 2 is complete, if it is not already, then waves 3, 4, and 5 must be completed before the larger wave (3) down will be complete. Using the rules of the Elliott wave principle, I have calculated that wave (3) down should be complete at or around 1409. We might drop this slightly to 1400, as the market likes round numbers. |
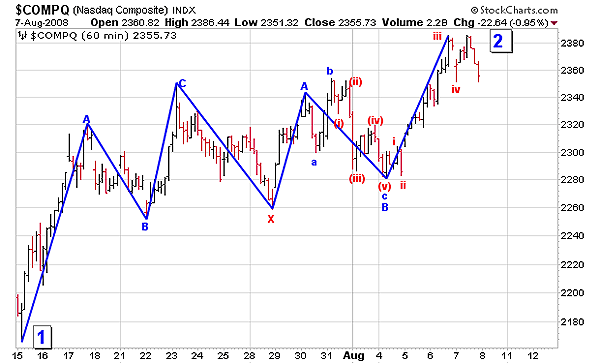
| Figure 2 shows the detail of corrective wave 2. This wave appears to be made up of two ABC zigzag corrective wave patterns. These two corrective waves are then connected together by an X wave. Note that these waves all overlap each other. One of the characteristics of corrective waves is that the waves overlap. Had this rally from mid-July been the start of a new upward trend, these waves would have been impulse and one of the Elliott wave rules for impulse waves is that they do not overlap. These wave patterns then show that the rally from mid-July is corrective in nature and not the beginning of a new upward market trend. Further, corrective rallies move against the direction of the main trend, which in the case of the NASDAQ would be down. |

|
| FIGURE 2: NASDAQ, 60-MINUTE. Here's the 60-minute price chart of the NASDAQ market index from mid-July. This chart shows that the current market rally is a countertrend corrective move as noted by the overlapping waves. |
| Graphic provided by: StockCharts.com. |
| |
| From our analysis that the NASDAQ is forming a larger impulse wave, which is to be composed of waves (1), (2), (3), (4), and (5) to the downward side, and our analysis that the current rally is corrective in nature and not impulsive, I conclude that what looks to be a double-bottom trend reversal pattern is not such a pattern and that the major direction of the NASDAQ looking forward is still going down. |
Alan Northam lives in the Dallas, Texas area and as an electronic engineer gave him an analytical mind from which he has developed a thorough knowledge of stock market technical analysis. His abilities to analyze the future direction of the stock market has allowed him to successfully trade of his own portfolio over the last 30 years. Mr. Northam is now retired and trading the stock market full time. You can reach him at inquiry@tradersclassroom.com or by visiting his website at http://www.tradersclassroom.com. You can also follow him on Twitter @TradersClassrm.
| Garland, Tx | |
| Website: | www.tradersclassroom.com |
| E-mail address: | inquiry@tradersclassroom.com |
Click here for more information about our publications!
Comments
Date: 08/22/08Rank: 5Comment:

Request Information From Our Sponsors
- StockCharts.com, Inc.
- Candle Patterns
- Candlestick Charting Explained
- Intermarket Technical Analysis
- John Murphy on Chart Analysis
- John Murphy's Chart Pattern Recognition
- John Murphy's Market Message
- MurphyExplainsMarketAnalysis-Intermarket Analysis
- MurphyExplainsMarketAnalysis-Visual Analysis
- StockCharts.com
- Technical Analysis of the Financial Markets
- The Visual Investor
- VectorVest, Inc.
- Executive Premier Workshop
- One-Day Options Course
- OptionsPro
- Retirement Income Workshop
- Sure-Fire Trading Systems (VectorVest, Inc.)
- Trading as a Business Workshop
- VectorVest 7 EOD
- VectorVest 7 RealTime/IntraDay
- VectorVest AutoTester
- VectorVest Educational Services
- VectorVest OnLine
- VectorVest Options Analyzer
- VectorVest ProGraphics v6.0
- VectorVest ProTrader 7
- VectorVest RealTime Derby Tool
- VectorVest Simulator
- VectorVest Variator
- VectorVest Watchdog
