HOT TOPICS LIST
- MACD
- Fibonacci
- RSI
- Gann
- ADXR
- Stochastics
- Volume
- Triangles
- Futures
- Cycles
- Volatility
- ZIGZAG
- MESA
- Retracement
- Aroon
INDICATORS LIST
LIST OF TOPICS
PRINT THIS ARTICLE
by James Kupfer
Sears is approaching a convergence of multiple factors that indicate it may be ready to resume its downtrend.
Position: Sell
James Kupfer
Mr. Kupfer is a market professional and amateur stock market commentator. Disclosure: It is likely that Mr. Kupfer has or will enter a position in any security he writes about.
PRINT THIS ARTICLE
TREND-CHANNEL
Sears Holding Corp. Topping?
08/08/08 08:34:30 AMby James Kupfer
Sears is approaching a convergence of multiple factors that indicate it may be ready to resume its downtrend.
Position: Sell
| Using a single indicator or chart formation as the basis of a trade may not be the safest or most consistent way to pick entry points. Instead, I tend to look for the convergence of multiple indicators or chart formations that lead to the same conclusion. |

|
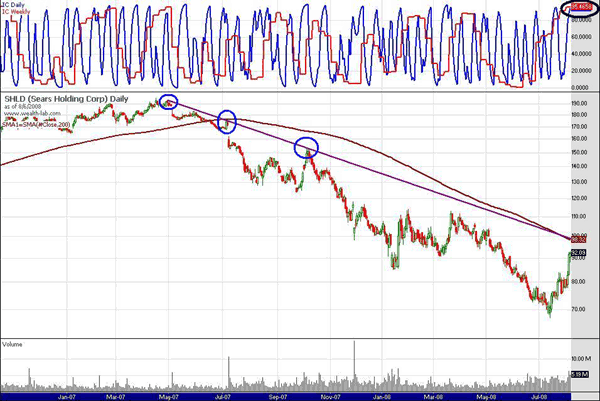
| FIGURE 1: SHLD, DAILY. The trendline has been formed and confirmed by three points (blue circles). |
| Graphic provided by: Wealth-Lab. |
| |
| Using this approach, Sears Holding (SHLD) is setting up with good short-term potential for a sell or short. First, Sears is in an obvious downtrend. Looking at Figure 1, you can see that Sears' trendline (purple line) has been formed and confirmed by three points (blue circles). It has been a number of months since that trendline was tested, but until shown otherwise I would assume it to be valid. Second, Sears has recently risen significantly and is now approaching its 200-day simple moving average (SMA), which is another potential point of resistance. Finally, both the daily and weekly versions of stochastics that I utilize are very overbought (red and blue in top panel). |
| Sears has been very strong recently, and, of course, there is no guarantee that it won't smash through these resistance levels. It would also be nice if around $99 would be a Fibonacci resistance level or mark a speed resistance level, but it doesn't. Regardless, there are enough reasons why shorting SHLD near $99 makes sense to make this a worthwhile potential play. Just make sure to keep your stops reasonable. |
Mr. Kupfer is a market professional and amateur stock market commentator. Disclosure: It is likely that Mr. Kupfer has or will enter a position in any security he writes about.
Click here for more information about our publications!
PRINT THIS ARTICLE

Request Information From Our Sponsors
- StockCharts.com, Inc.
- Candle Patterns
- Candlestick Charting Explained
- Intermarket Technical Analysis
- John Murphy on Chart Analysis
- John Murphy's Chart Pattern Recognition
- John Murphy's Market Message
- MurphyExplainsMarketAnalysis-Intermarket Analysis
- MurphyExplainsMarketAnalysis-Visual Analysis
- StockCharts.com
- Technical Analysis of the Financial Markets
- The Visual Investor
- VectorVest, Inc.
- Executive Premier Workshop
- One-Day Options Course
- OptionsPro
- Retirement Income Workshop
- Sure-Fire Trading Systems (VectorVest, Inc.)
- Trading as a Business Workshop
- VectorVest 7 EOD
- VectorVest 7 RealTime/IntraDay
- VectorVest AutoTester
- VectorVest Educational Services
- VectorVest OnLine
- VectorVest Options Analyzer
- VectorVest ProGraphics v6.0
- VectorVest ProTrader 7
- VectorVest RealTime Derby Tool
- VectorVest Simulator
- VectorVest Variator
- VectorVest Watchdog
