HOT TOPICS LIST
- MACD
- Fibonacci
- RSI
- Gann
- ADXR
- Stochastics
- Volume
- Triangles
- Futures
- Cycles
- Volatility
- ZIGZAG
- MESA
- Retracement
- Aroon
INDICATORS LIST
LIST OF TOPICS
PRINT THIS ARTICLE
by Arthur Hill
After a very short oversold bounce, a host of short-term bearish indications surfaced on the AIG chart, and the stock looks like it is headed for new lows.
Position: N/A
Arthur Hill
Arthur Hill is currently editor of TDTrader.com, a website specializing in trading strategies, sector/industry specific breadth stats and overall technical analysis. He passed the Society of Technical Analysts (STA London) diploma exam with distinction is a Certified Financial Technician (CFTe). Prior to TD Trader, he was the Chief Technical Analyst for Stockcharts.com and the main contributor to the ChartSchool.
PRINT THIS ARTICLE
ISLAND REVERSAL
Bearish Signals Point To New Lows For AIG
08/07/08 01:27:19 PMby Arthur Hill
After a very short oversold bounce, a host of short-term bearish indications surfaced on the AIG chart, and the stock looks like it is headed for new lows.
Position: N/A
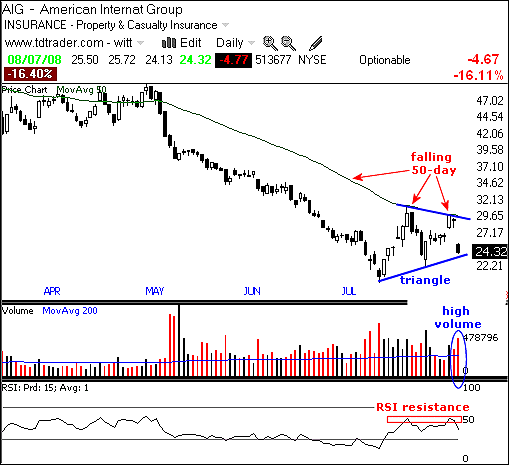
| Figure 1 shows AIG International (AIG) with a very steep decline from May to early July. The stock bounced in July, but only made it back to the falling 50-day moving average. AIG hit resistance at this moving average in mid-July and again in early August. With a gap lower on August 7, a triangle is taking shape and a break below triangle support would project a move to new lows. |

|
| FIGURE 1: AIG, DAILY. Note the very steep decline from May to early July. |
| Graphic provided by: TeleChart2007. |
| |
| Momentum turned down as volume turned up. With the oversold bounce, the relative strength index (RSI) met resistance around 50 in mid-July and again in early August (red box). In a downtrend, the 50-60 zone acts as resistance. With the gap down on August 7, the RSI turned lower and momentum is heading back toward oversold levels. The gap and decline from the 50-day moving average occurred on high volume, and this shows expanding selling pressure that will likely drive the stock to new lows. |
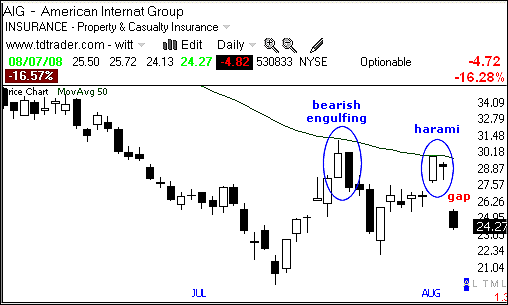
| Figure 2 focuses on three short-term bearish patterns over the last few weeks. First, AIG formed a bearish engulfing pattern at the 50-day moving average in mid-July. Second, the stock formed a harami at the 50-day mark in early August. The harami itself is a neutral pattern that shows sudden indecision. After a short advance and long white candlestick, AIG suddenly stalled with an inside day as the advance stopped. The gap down and sharp decline confirm this harami as bearish. |

|
| FIGURE 2: AIG, DAILY. Note the three short-term bearish patterns. |
| Graphic provided by: TeleChart2007. |
| |
| For the third pattern, gaps on either side of the harami formed an island reversal. AIG gapped up to form the long white candlestick and gapped down the last trading day shown. Buyers at the harami levels are now trapped with losses after the stock gapped down and left them stranded. This gap is bearish as long as it remains unfilled. Look for a move above the 50-day moving average to undo all this technical damage. |
Arthur Hill is currently editor of TDTrader.com, a website specializing in trading strategies, sector/industry specific breadth stats and overall technical analysis. He passed the Society of Technical Analysts (STA London) diploma exam with distinction is a Certified Financial Technician (CFTe). Prior to TD Trader, he was the Chief Technical Analyst for Stockcharts.com and the main contributor to the ChartSchool.
| Title: | Editor |
| Company: | TDTrader.com |
| Address: | Willem Geetsstraat 17 |
| Mechelen, B2800 | |
| Phone # for sales: | 3215345465 |
| Website: | www.tdtrader.com |
| E-mail address: | arthurh@tdtrader.com |
Traders' Resource Links | |
| TDTrader.com has not added any product or service information to TRADERS' RESOURCE. | |
Click here for more information about our publications!
Comments
Date: 08/08/08Rank: 2Comment:

Request Information From Our Sponsors
- StockCharts.com, Inc.
- Candle Patterns
- Candlestick Charting Explained
- Intermarket Technical Analysis
- John Murphy on Chart Analysis
- John Murphy's Chart Pattern Recognition
- John Murphy's Market Message
- MurphyExplainsMarketAnalysis-Intermarket Analysis
- MurphyExplainsMarketAnalysis-Visual Analysis
- StockCharts.com
- Technical Analysis of the Financial Markets
- The Visual Investor
- VectorVest, Inc.
- Executive Premier Workshop
- One-Day Options Course
- OptionsPro
- Retirement Income Workshop
- Sure-Fire Trading Systems (VectorVest, Inc.)
- Trading as a Business Workshop
- VectorVest 7 EOD
- VectorVest 7 RealTime/IntraDay
- VectorVest AutoTester
- VectorVest Educational Services
- VectorVest OnLine
- VectorVest Options Analyzer
- VectorVest ProGraphics v6.0
- VectorVest ProTrader 7
- VectorVest RealTime Derby Tool
- VectorVest Simulator
- VectorVest Variator
- VectorVest Watchdog
