HOT TOPICS LIST
- MACD
- Fibonacci
- RSI
- Gann
- ADXR
- Stochastics
- Volume
- Triangles
- Futures
- Cycles
- Volatility
- ZIGZAG
- MESA
- Retracement
- Aroon
INDICATORS LIST
LIST OF TOPICS
PRINT THIS ARTICLE
by James Kupfer
The S&P 500 as well as the DJIA appear to be forming flag formations. What does this portend for the market?
Position: Sell
James Kupfer
Mr. Kupfer is a market professional and amateur stock market commentator. Disclosure: It is likely that Mr. Kupfer has or will enter a position in any security he writes about.
PRINT THIS ARTICLE
FLAGS AND PENNANTS
S&P 500 Flagging For Help
08/07/08 01:23:45 PMby James Kupfer
The S&P 500 as well as the DJIA appear to be forming flag formations. What does this portend for the market?
Position: Sell
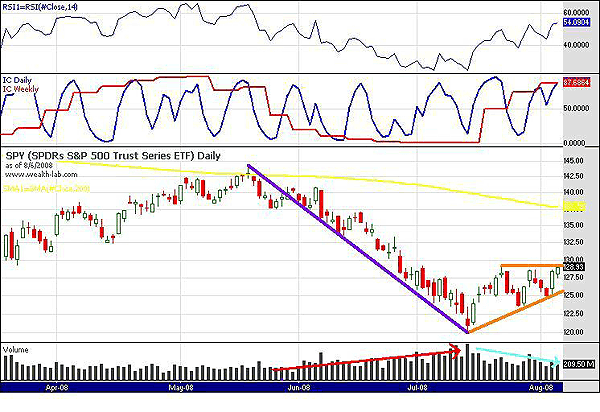
| A flag formation is a short-term continuation pattern. Since the Standard & Poor's 500 and Dow Jones Industrial Average (DJIA) both appear to be forming very similar flag formations, they may be preparing to resume their downtrend. In addition, the flag formation allows us to define a price target for the indexes. |

|
| FIGURE 1: SPY, DAILY. What does the flag formation indicate? |
| Graphic provided by: Wealth-Lab. |
| |
| There are a few characteristics that define a flag. First, there needs to be an established trend up or down in place before the flag formation. The purple line clearly shows an established downtrend (Figure 1). Second, the flag needs to be formed within one to eight (some say 12) weeks. The flag shown below that (orange lines) is about three weeks old. Third, volume should be high during the initial trend (red line in the volume pane) and decrease during the flag formation (light blue line in the volume pane). Each of these three conditions has been met thus far. |
| Until such time as price breaks below the upward-sloping orange trend line the pattern will not be complete. Assuming this transpires, we can calculate a price target for the S&P 500 exchange traded fund (ETF) proxy, SPY, as follows: find the difference between the beginning of the flag and the start of the recent trend and subtract it from the flag breakout. Trend start: $139.50 (on 5/21/08) Flag start: $120 (on 7/15/08) Difference = $19.50 |
| Since the flag has not yet broken out, it may happen around $125. Subtracting $19.50 from $125 leads to a rough price target of $105.50. |
Mr. Kupfer is a market professional and amateur stock market commentator. Disclosure: It is likely that Mr. Kupfer has or will enter a position in any security he writes about.
Click here for more information about our publications!
Comments
Date: 08/12/08Rank: 4Comment:
Date: 08/13/08Rank: 5Comment:

Request Information From Our Sponsors
- StockCharts.com, Inc.
- Candle Patterns
- Candlestick Charting Explained
- Intermarket Technical Analysis
- John Murphy on Chart Analysis
- John Murphy's Chart Pattern Recognition
- John Murphy's Market Message
- MurphyExplainsMarketAnalysis-Intermarket Analysis
- MurphyExplainsMarketAnalysis-Visual Analysis
- StockCharts.com
- Technical Analysis of the Financial Markets
- The Visual Investor
- VectorVest, Inc.
- Executive Premier Workshop
- One-Day Options Course
- OptionsPro
- Retirement Income Workshop
- Sure-Fire Trading Systems (VectorVest, Inc.)
- Trading as a Business Workshop
- VectorVest 7 EOD
- VectorVest 7 RealTime/IntraDay
- VectorVest AutoTester
- VectorVest Educational Services
- VectorVest OnLine
- VectorVest Options Analyzer
- VectorVest ProGraphics v6.0
- VectorVest ProTrader 7
- VectorVest RealTime Derby Tool
- VectorVest Simulator
- VectorVest Variator
- VectorVest Watchdog
