HOT TOPICS LIST
- MACD
- Fibonacci
- RSI
- Gann
- ADXR
- Stochastics
- Volume
- Triangles
- Futures
- Cycles
- Volatility
- ZIGZAG
- MESA
- Retracement
- Aroon
INDICATORS LIST
LIST OF TOPICS
PRINT THIS ARTICLE
by Chaitali Mohile
The bull run in the Dow Jones Industrial Average halted its upward climb.The correction that began from the new high is likely to find an important support. Can we see a bottom?
Position: N/A
Chaitali Mohile
Active trader in the Indian stock markets since 2003 and a full-time writer. Trading is largely based upon technical analysis.
PRINT THIS ARTICLE
RETRACEMENT
DJIA Finds Support
08/12/08 09:54:02 AMby Chaitali Mohile
The bull run in the Dow Jones Industrial Average halted its upward climb.The correction that began from the new high is likely to find an important support. Can we see a bottom?
Position: N/A
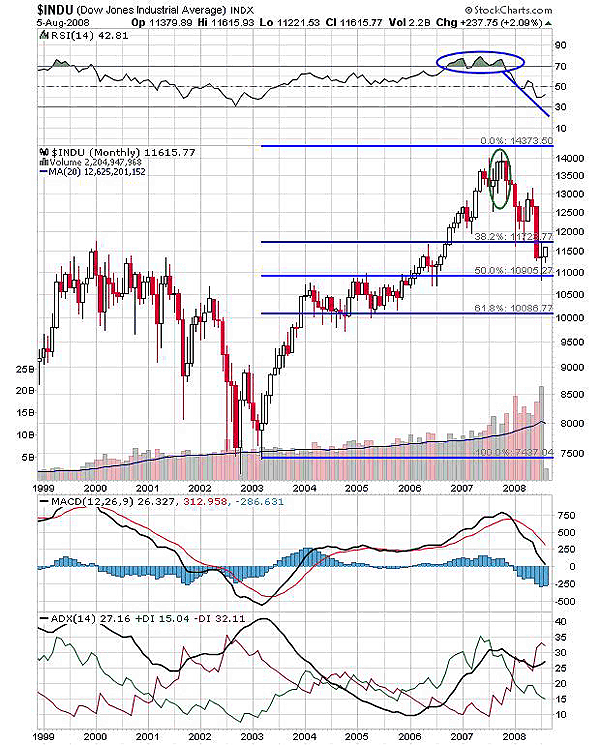
| The Fibonacci retracement is a tool used to identify support/resistance levels or even target levels. Among the various retracement levels, 50% is important since it represents an area where a stock or index may change direction. Any correction till this support is considered to be a reaction to the previous advance rally. In Figure 1, I used Fibonacci retracement levels with the low of 2003 at 7437 and high at 14373 made in 2007. During the rally, the relative strength index (RSI)(14) turned overbought as the DJIA ($INDU) surged from 12500 to 14000. Though $INDU made an all-time high at 14373, the RSI (14) remained overbought without moving higher. We can also see that the high was made by the long-legged doji, which indicates indecision between buyers and sellers. In addition, the marked green circle in Figure 1 shows the evening doji star reversal candlestick pattern. So, the negative divergence, long-legged doji, and evening doji star together resulted in a significant correction. |

|
| FIGURE 1: $INDU, MONTHLY. The index is likely to consolidate between the two retracement levels of 38.2% and 50%. |
| Graphic provided by: StockCharts.com. |
| |
| On these three bearish notes, $INDU plunged below the 38.2% retracement level and continued to move deeper. The long-legged doji's lower shadow touched the 50% level, and gradually the index moved toward the previous low of 2006. Thus, the index has entered a strong support zone. The average directional movement index (ADX) (14) in Figure 1 indicates a developing downtrend with reducing buying pressure. However, the moving average convergence/divergence (MACD) (12,26,9) is above the zero line, and the RSI (14) is ready to move upward with the support of 30. This scenario points to a rangebound movement between the 38.2% and 50% retracement levels. |

|
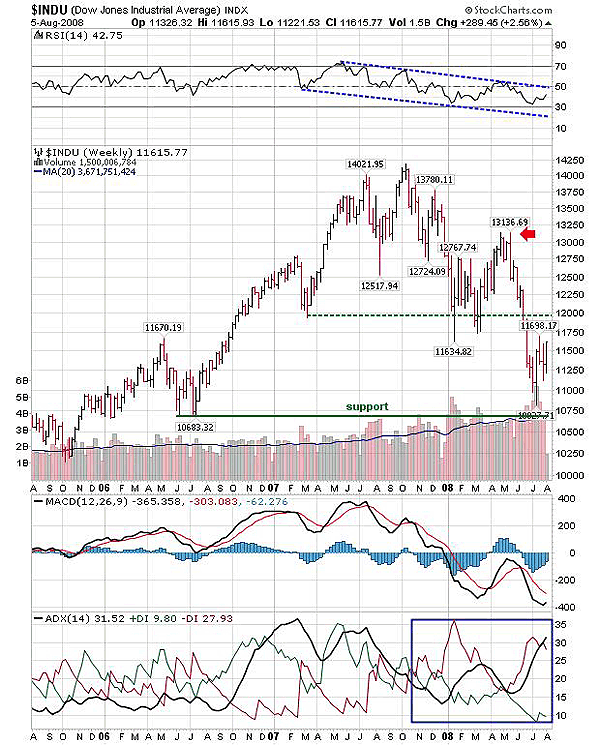
| FIGURE 2: $INDU, WEEKLY. The ADX (14) indicates a developed downtrend. The lowest support at 10683 is highly important for a bottom formation. |
| Graphic provided by: StockCharts.com. |
| |
| In 2006, the bull run began with the support of 10683.23 and hit the all-time high of 14373 by October 2007. The index corrected, as the advance rally reached its first high at 14021, and later a higher top at 14373 was formed. Due to this double-top reversal pattern, the index declined and entered the intermediate downtrend. In Figure 2, we can see that at various support levels the index witnessed either a pullback rally or moved sideways -- for example, the support level at 12000. Traders can note that near the support level of 12000, the index moved sideways for a period of two or three months, and then formed a lower high at 13136. Thereafter, all bullish sentiments diminished, and $INDU corrected further. The downside journey finally halted near the strong support zone at 10827. Though the exact low of 2006 was not tested, 10600-10800 is seen as the support zone. |
| As we can see in Figure 2, the index surged higher, forming support at the 10800 level and remained rangebound. However, the range is quite wide, and volume is likely to be highly volatile. The RSI (14) shows a descending trendline channel, but the indicator has turned up without resting on support at the 30 level or even on the lower trend line (see Figure 2). If the upper trendline is violated, then we can experience new bullish strength. The ADX(14) indicates a developing downtrend, and the MACD (12,26,9) has moved deep into negative territory. Both these indicators are bearish, and therefore the beginning of a fresh rally seems unlikely. In addition, the present market sentiments are not positive to bring back the traders' confidence. |
| The big picture shows that $INDU has found strong support and also shows the possibility of consolidation at lower levels. This consolidation may form a strong bottom for a future rally. |
Active trader in the Indian stock markets since 2003 and a full-time writer. Trading is largely based upon technical analysis.
| Company: | Independent |
| Address: | C1/3 Parth Indraprasth Towers. Vastrapur |
| Ahmedabad, Guj 380015 | |
| E-mail address: | chaitalimohile@yahoo.co.in |
Traders' Resource Links | |
| Independent has not added any product or service information to TRADERS' RESOURCE. | |
Click here for more information about our publications!
Comments

Request Information From Our Sponsors
- StockCharts.com, Inc.
- Candle Patterns
- Candlestick Charting Explained
- Intermarket Technical Analysis
- John Murphy on Chart Analysis
- John Murphy's Chart Pattern Recognition
- John Murphy's Market Message
- MurphyExplainsMarketAnalysis-Intermarket Analysis
- MurphyExplainsMarketAnalysis-Visual Analysis
- StockCharts.com
- Technical Analysis of the Financial Markets
- The Visual Investor
- VectorVest, Inc.
- Executive Premier Workshop
- One-Day Options Course
- OptionsPro
- Retirement Income Workshop
- Sure-Fire Trading Systems (VectorVest, Inc.)
- Trading as a Business Workshop
- VectorVest 7 EOD
- VectorVest 7 RealTime/IntraDay
- VectorVest AutoTester
- VectorVest Educational Services
- VectorVest OnLine
- VectorVest Options Analyzer
- VectorVest ProGraphics v6.0
- VectorVest ProTrader 7
- VectorVest RealTime Derby Tool
- VectorVest Simulator
- VectorVest Variator
- VectorVest Watchdog
