

HOT TOPICS LIST
- MACD
- Fibonacci
- RSI
- Gann
- ADXR
- Stochastics
- Volume
- Triangles
- Futures
- Cycles
- Volatility
- ZIGZAG
- MESA
- Retracement
- Aroon
INDICATORS LIST
LIST OF TOPICS
PRINT THIS ARTICLE
by Alan R. Northam
XLU has been in a bull market trend since 2002, but that trend looks to be ending with a head & shoulders trend reversal pattern.
Position: N/A
Alan R. Northam
Alan Northam lives in the Dallas, Texas area and as an electronic engineer gave him an analytical mind from which he has developed a thorough knowledge of stock market technical analysis. His abilities to analyze the future direction of the stock market has allowed him to successfully trade of his own portfolio over the last 30 years. Mr. Northam is now retired and trading the stock market full time. You can reach him at inquiry@tradersclassroom.com or by visiting his website at http://www.tradersclassroom.com. You can also follow him on Twitter @TradersClassrm.
PRINT THIS ARTICLE
HEAD & SHOULDERS
Utilities Select SPDR Head & Shoulders
08/06/08 01:15:55 PMby Alan R. Northam
XLU has been in a bull market trend since 2002, but that trend looks to be ending with a head & shoulders trend reversal pattern.
Position: N/A
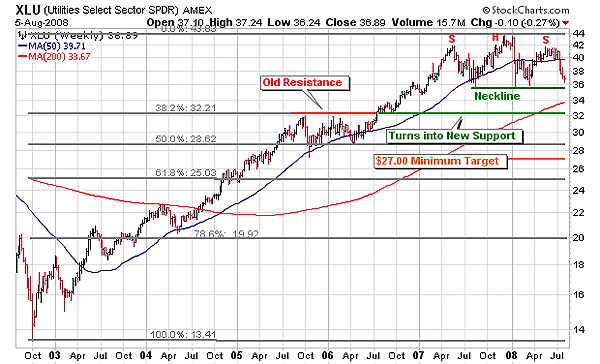
| Figure 1 is that of the weekly Utilities Select SPDR bar chart (XLU). This chart shows that the utilities sector has been in a bull market trend since October 2002. From mid-2007 until August 2008, the utilities sector has been printing out what looks to be the formation of a head & shoulders reversal pattern. Head & shoulders patterns often appear on the charts after a long run up in prices during a bull market or a long selloff period during bear markets. Head & shoulders patterns normally appear at the end of a trend and as such are reversal patterns. Head & shoulders patterns can also be continuation patterns that occur during market advances or declines. However, in these cases the head & shoulders patterns are typically reversed or upside down. In an upward trend, the continuation form of the head & shoulders pattern will normally be with the head & shoulders pointing in the downward direction instead of pointing upward. In a downtrend, the continuation form is with the head & shoulders pointing upward instead of downward. This makes it easy to identify the trend reversal form of the H&S pattern from the continuation form. In the present case, the head & shoulders are pointing up, indicating the reversal form. |
|
| FIGURE 1: XLU, WEEKLY. This bar chart shows the head & shoulders reversal pattern and minimum expected price target of $27. This chart also shows support levels and the Fibonacci retracement levels. |
| Graphic provided by: StockCharts.com. |
| |
| Although it appears that a head & shoulders reversal pattern is developing, it has not yet been confirmed as a valid head & shoulders pattern. To be validated, the price must continue to trade on down and break down below the neckline of the H&S pattern. The neckline is drawn off the price minimum between the left shoulder and the head, and the right shoulder and the head. At times, the price minimum between the head and the right shoulder will not be the same as the price minimum between the left shoulder and the head. This will result in the neckline slanting either slightly up or down, whichever the case may be. In our case here, the neckline is horizontal. Some market technicians will accept any breakdown below the neckline to validate the head & shoulders pattern as a reversal signal while others wait for a confirmation of the breakdown. A confirmation of the breakdown below the neckline is typically set at 3%. In other words, some market technicians will wait for the market to move 3% below the neckline before accepting the breakdown as a valid breakdown. This helps to reduce whipsaws, where the market turns back upward and continues to trade higher. However, the 3% rule is not 100% perfect and the market can still turn back upward and make a new high. |
| The head & shoulders pattern also provides a forecast of the future minimum expected price target. This price target is calculated by taking the difference in the price of the lower of the two price minimums between the two shoulders and the head and subtracting it from the price maximum of the head. This difference is then subtracted from the breakdown price, which in the case of the utilities sector yields a price target of $27, or 27% lower than its current price. Keep in mind, however, that this is an expected minimum price target for XLU, and in reality, price could fall to much lower levels before reaching its ultimate low price. |
| There are, however, a few support barriers that price will have to overcome before reaching this expected minimum price target. One is the head & shoulders neckline itself. This support level must be clearly broken before expecting XLU to move significantly lower. The 3% rule for confirming a breakdown would be a good gauge to use for a clear breakdown of the neckline. The second support line is the 200-day moving average. The third support line comes in twos: First, there is the old resistance that was formed back in late 2005 and early 2006. This resistance barrier was broken, turning it into new support. At the same price level, we also have the 38.2% Fibonacci retracement level. When support levels cluster around a common price point, that support level becomes extra strong, so XLU could find it difficult to break down below this level. What could happen at this clustered support level is for price to come down to it and bounce off and then attack it a second time before breaking down below it. But if the bull market trend for the utilities sector is truly over, then this clustered support level should eventually be broken. The next lower support level is the 50% Fibonacci retracement level. The 50% level is a typical place for the market to turn back up. So again, price may bounce off this level before eventually breaking down below it. And again, if the bull market for the utilities is indeed over, the 50% level should eventually be taken out. If price makes it through all these support levels, then expect it to hit the minimum price target for the move down. Further, should XLU continue to move lower and make a clear break below the 78.6% Fibonacci retracement level, then expect the selloff to continue for quite some time. Look for a reversal trading pattern, such as an upside down head & shoulders pattern or a double bottom or some other reversal pattern, to determine the ultimate low price for XLU. |
| In conclusion, XLU looks to be making a head & shoulders reversal pattern. A clear breakdown below its neckline of 3% will validate this pattern as a true reversal pattern. Following the breakdown, expect the price to continue lower until it hits its minimum expected price target of $27. Keep in mind, however, that $27 is an expected minimum price target and price may actually continue lower before reaching its ultimate low price. Look for a reversal trading pattern to determine when the downward move is over. |
Alan Northam lives in the Dallas, Texas area and as an electronic engineer gave him an analytical mind from which he has developed a thorough knowledge of stock market technical analysis. His abilities to analyze the future direction of the stock market has allowed him to successfully trade of his own portfolio over the last 30 years. Mr. Northam is now retired and trading the stock market full time. You can reach him at inquiry@tradersclassroom.com or by visiting his website at http://www.tradersclassroom.com. You can also follow him on Twitter @TradersClassrm.
| Garland, Tx | |
| Website: | www.tradersclassroom.com |
| E-mail address: | inquiry@tradersclassroom.com |
Click here for more information about our publications!
Comments
Date:�08/07/08Rank:�4Comment:�

Request Information From Our Sponsors
- VectorVest, Inc.
- Executive Premier Workshop
- One-Day Options Course
- OptionsPro
- Retirement Income Workshop
- Sure-Fire Trading Systems (VectorVest, Inc.)
- Trading as a Business Workshop
- VectorVest 7 EOD
- VectorVest 7 RealTime/IntraDay
- VectorVest AutoTester
- VectorVest Educational Services
- VectorVest OnLine
- VectorVest Options Analyzer
- VectorVest ProGraphics v6.0
- VectorVest ProTrader 7
- VectorVest RealTime Derby Tool
- VectorVest Simulator
- VectorVest Variator
- VectorVest Watchdog
- StockCharts.com, Inc.
- Candle Patterns
- Candlestick Charting Explained
- Intermarket Technical Analysis
- John Murphy on Chart Analysis
- John Murphy's Chart Pattern Recognition
- John Murphy's Market Message
- MurphyExplainsMarketAnalysis-Intermarket Analysis
- MurphyExplainsMarketAnalysis-Visual Analysis
- StockCharts.com
- Technical Analysis of the Financial Markets
- The Visual Investor