HOT TOPICS LIST
- MACD
- Fibonacci
- RSI
- Gann
- ADXR
- Stochastics
- Volume
- Triangles
- Futures
- Cycles
- Volatility
- ZIGZAG
- MESA
- Retracement
- Aroon
INDICATORS LIST
LIST OF TOPICS
PIVOT POINT
Pivots
06/05/01 03:11:02 PMby Dennis D. Peterson
An alternative to indicators
Position: N/A
| Which came first, the observation or the indicator? I would wager that in every case, except for Fibonacci numbers, the observation came first. When you understand why indicators work you get a better grasp of price and volume behavior. Indicators are the starting point in your effort to understand market behavior and are the culmination of an analyst's observations about behavior. A simple characterization of the market is that it is either in a trend or going sideways. Some indicators such as the MACD work well in a trending market whereas others such as the stochastics work better in a sideways one. Neither of them will help you understand what to do with breakout or breakdown gaps. When you start viewing the market as a place that can have trends, and that trends can be interrupted by three day reversals, more noticeably by wedges, and swing points, you are starting to think like someone who is trading for a living. To understand the strengths and weaknesses of indicators like you need to know how the market behaves. Choppy markets occur within a price channel. Price movements within channels can be volatile or relatively quiet. Quiet markets, ala Bollinger, are markets that are deciding. It is the quiet period that swing traders wait for. Price volatility expansion can be especially evident in consolidations when the upper threshold is approached with increasing volume. Heavy volume approaching the upside is warning of resistance whereas heavy volume on the lower threshold says there are buyers, indicating a support level. Volume tells you more than you'll get out of most indicators. If someone walked up to you and said sell these 1,000,000 shares of XYZ stock and get a price better than your peers, or we'll find someone who can, what are you going to do? Dump them all at once? Not hardly. You would sell them when the price starts going up. Then you would buy a few back to maintain price. The net effect is to sell every time the price goes up. If you are lucky you create a consolidation and as long as the demand continues, you can keep selling at a profit, hopefully better than your peers. Keeping an eye on volume gives you an idea of which way prices are likely to break out of a consolidation (heavy volume at the upper threshold warns of an impending downtrend, heavy volume at the lower threshold warns of an impending uptrend). Consolidations are an important event because buyers and sellers are meeting head on. They often represent the 50% point in a trend or can be the top or bottom of a move. The amount of price volatlity within a consolidation has significance. |
| Like consolidations, trend (or swing) turning points are important events. These turning points are referred to as pivot points. Pivots are a name used for two different events. I introduced one use of the term pivots in my posting on 12/20/00 called "Nasdaq, Pivot Points and Stops." This is a non-indicator approach to judging market action based on stop-losses for short and long positions. Another definition of a pivot is the point at which price has reversed. Alternatively it could be called a swing point. If the OHLC bars preceding and following a bar has a close above the close of the bar then that bar is a pivot. It's a low point. Similarly, if the OHLC bars preceding and following a bar have closes below the close of the bar, then the bar is also a pivot. This time it's a high point. I prefer to see the number of closes before the bar indicate a clear trend or swing. I generally have to wait at least three bars after the candidate pivot point before I am comfortable with declaring a bar to be a pivot. I don't want to get caught with a third day reversal. A pivot is a price at which the market changed swing direction. |

|
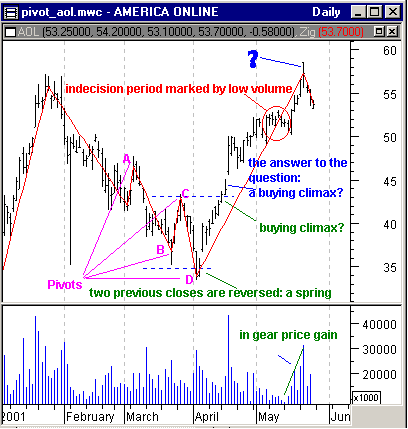
| Figure 1: AOL daily price and volume. Two pivots are identified. The first pivot in March identifies the point at which the price decline reversed or pivoted from a downtrend to an upswing. ZigZag with an 8% change is shown in red overlaying price history. |
| Graphic provided by: MetaStock. |
| Graphic provided by: Data vendor: eSignal<. |
| |
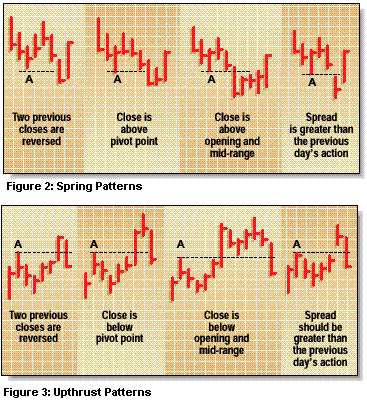
| Pivots (Figure 1) are as the name implies, turning points in price direction. If the market comes to the same price from the same direction a second time there are some patterns that have a high degree of success in predicting the direction of the market. I have identified four pivots with AOL price movement in Figure 1. As you can see there are more than just the four - using ZigZag with an 8% change confirms the points I have labeled A, B, C and D. Again, I initially identified the pivots using the rules stated above and not ZigZag. Pivot D was the first retest of the low established by pivot B. There is a clue coming into this retest at D. Pivot C had low volume. There wasn't a heavy hitter looking to sell. This potentially means that there could be an upswing and a push right on through the price at C. The close of the bar on April 3 goes below the low of pivot B, which makes you wonder what will happen on April 4. The close of April 4 is above that of April 3. A spring has been made. Springs have patterns (see Figure 2). A spring up (pivot point D) is looking very good. On April 5 the spring unloads and you gap up. You would enter a long position at the open on April 5 if the open is above the high of April 4 - a confirmed spring. You are now riding the price up. The next event will be the price established by pivot point C. Is the price going to be an upthrust that meets with a buying climax? Upthrusts also have patterns (see Figure 3). On April 16 the first part of a potential upthrust pattern emerges. On the following day there is a failure of an upthrust pattern. It is likely that prices will go on up but it won't be till April 18 when you get a confirming answer. You would have had to exit your trade on April 16. On April 18 you should go long only if the open is higher than the close of April 17. Is there any indicator that would have told you about these kinds of trades?
|
| The key is to watch volume and price moves. Is the volume low for the one or two-day price rise or is there substantial buying? Panic selling will create a bottom that may lead to a bounce back up and possibly another downturn, but on lowered volume. Watch the price story unfold by analyzing price, price and volume volatility, and pivot points. Use intraday data to confirm the true nature of daily bar data. If you had to buy or sell 1,000,000 shares of AOL what would you do? |
Market index trading on a daily basis.
| Title: | Staff Writer |
| Company: | Technical Analysis, Inc. |
| Address: | 4757 California Ave SW |
| Seattle, WA 98116-4499 | |
| Phone # for sales: | 206 938 0570 |
| Fax: | 206 938 1307 |
| Website: | www.traders.com |
| E-mail address: | dpeterson@traders.com |
Traders' Resource Links | |
| Charting the Stock Market: The Wyckoff Method -- Books | |
| Working-Money.com -- Online Trading Services | |
| Traders.com Advantage -- Online Trading Services | |
| Technical Analysis of Stocks & Commodities -- Publications and Newsletters | |
| Working Money, at Working-Money.com -- Publications and Newsletters | |
| Traders.com Advantage -- Publications and Newsletters | |
| Professional Traders Starter Kit -- Software | |
Click here for more information about our publications!
Comments

Request Information From Our Sponsors
- VectorVest, Inc.
- Executive Premier Workshop
- One-Day Options Course
- OptionsPro
- Retirement Income Workshop
- Sure-Fire Trading Systems (VectorVest, Inc.)
- Trading as a Business Workshop
- VectorVest 7 EOD
- VectorVest 7 RealTime/IntraDay
- VectorVest AutoTester
- VectorVest Educational Services
- VectorVest OnLine
- VectorVest Options Analyzer
- VectorVest ProGraphics v6.0
- VectorVest ProTrader 7
- VectorVest RealTime Derby Tool
- VectorVest Simulator
- VectorVest Variator
- VectorVest Watchdog
- StockCharts.com, Inc.
- Candle Patterns
- Candlestick Charting Explained
- Intermarket Technical Analysis
- John Murphy on Chart Analysis
- John Murphy's Chart Pattern Recognition
- John Murphy's Market Message
- MurphyExplainsMarketAnalysis-Intermarket Analysis
- MurphyExplainsMarketAnalysis-Visual Analysis
- StockCharts.com
- Technical Analysis of the Financial Markets
- The Visual Investor

