HOT TOPICS LIST
- MACD
- Fibonacci
- RSI
- Gann
- ADXR
- Stochastics
- Volume
- Triangles
- Futures
- Cycles
- Volatility
- ZIGZAG
- MESA
- Retracement
- Aroon
INDICATORS LIST
LIST OF TOPICS
PRINT THIS ARTICLE
by Koos van der Merwe
Titan Machinery represents a diversified mix of agricultural, construction, and consumer products dealership across much of the upper Midwest. Is it going up?
Position: Buy
Koos van der Merwe
Has been a technical analyst since 1969, and has worked as a futures and options trader with First Financial Futures in Johannesburg, South Africa.
PRINT THIS ARTICLE
OSCILLATORS
Up Goes Titan Machinery?
08/04/08 03:40:30 PMby Koos van der Merwe
Titan Machinery represents a diversified mix of agricultural, construction, and consumer products dealership across much of the upper Midwest. Is it going up?
Position: Buy
| Titan Machinery (TITN) consists of only 48 stores located in North Dakota, South Dakota, Minnesota, Iowa, and Nebraska. The company is a dealer for Case IH, Case Construction, New Holland, and New Holland Construction. They also represent shortline equipment to meet specialized customer demand and niche product means. So... with the high cost of oil, why buy the company shares? Are they selling more machinery? Have a look at Figure 1. |

|
| FIGURE 1: TITN, MONTHLY. This chart shows buy signals and the strategy vote line suggesting a buy signal. |
| Graphic provided by: Omnitrader.. |
| |
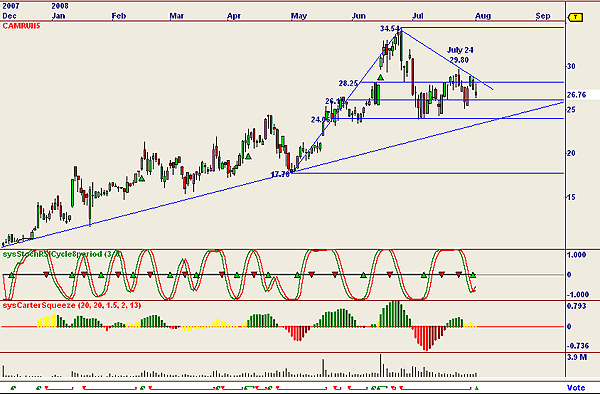
| The chart shows how the price increased from December 2007 when it traded at a low of $9.18, rising to a high of $34.54 by June 2008, contrary to the market trend, which was negative from July 2007. The share price fell to a low of $24.06, the 61.8% Fibonacci retracement, before recovering to 29.80 on July 24. On June 16, the company announced the results of the fiscal first quarter, where revenue increased to $153 million and operating income grew to $6.4 million. Gross profit increased to $24.6 million compared to $12.8 million in the first quarter of the prior year, with a gross profit margin unchanged at 16.1% but an increase in operating margin from 3.5% to 4.2%. Why? The answer, a continued strong agricultural economy probably, as the country gears up for the production of ethanol in the fight of high oil prices. On July 18, Titan Machinery became part of the Russell 2000 index, and this after the price has fallen. Figure 2 is an OmniTrader chart, with the preferred indicators the John Carter squeeze indicator and the stochastic RSI cycle with eight periods. Both indicators have given a buy signal. |

|
| FIGURE 2: STRATEGY. This strategy gives a buy signal. |
| Graphic provided by: Omnitrader. |
| |
| The strategy used is shown in Figure 2 and uses a 2% stop-loss from the highest high. OmniTrader users can email me for the strategy components. As shown, the vote line for the strategy has been remarkably accurate in its previous signals, giving a ROI of 23.2% for the period of the chart. It has given a buy signal. We can therefore consider buying the stock. |
Has been a technical analyst since 1969, and has worked as a futures and options trader with First Financial Futures in Johannesburg, South Africa.
| Address: | 3256 West 24th Ave |
| Vancouver, BC | |
| Phone # for sales: | 6042634214 |
| E-mail address: | petroosp@gmail.com |
Click here for more information about our publications!
Comments
Date: 08/05/08Rank: 1Comment:

Request Information From Our Sponsors
- StockCharts.com, Inc.
- Candle Patterns
- Candlestick Charting Explained
- Intermarket Technical Analysis
- John Murphy on Chart Analysis
- John Murphy's Chart Pattern Recognition
- John Murphy's Market Message
- MurphyExplainsMarketAnalysis-Intermarket Analysis
- MurphyExplainsMarketAnalysis-Visual Analysis
- StockCharts.com
- Technical Analysis of the Financial Markets
- The Visual Investor
- VectorVest, Inc.
- Executive Premier Workshop
- One-Day Options Course
- OptionsPro
- Retirement Income Workshop
- Sure-Fire Trading Systems (VectorVest, Inc.)
- Trading as a Business Workshop
- VectorVest 7 EOD
- VectorVest 7 RealTime/IntraDay
- VectorVest AutoTester
- VectorVest Educational Services
- VectorVest OnLine
- VectorVest Options Analyzer
- VectorVest ProGraphics v6.0
- VectorVest ProTrader 7
- VectorVest RealTime Derby Tool
- VectorVest Simulator
- VectorVest Variator
- VectorVest Watchdog
